Lincoln County, NV Map & Demographics
Lincoln County Map
Lincoln County Overview
$32,459
PER CAPITA INCOME
$85,950
AVG FAMILY INCOME
$67,412
AVG HOUSEHOLD INCOME
35.6%
WAGE / INCOME GAP [ % ]
64.4¢/ $1
WAGE / INCOME GAP [ $ ]
$14,991
FAMILY INCOME DEFICIT
0.38
INEQUALITY / GINI INDEX
4,507
TOTAL POPULATION
2,516
MALE POPULATION
1,991
FEMALE POPULATION
126.37
MALES / 100 FEMALES
79.13
FEMALES / 100 MALES
40.6
MEDIAN AGE
3.1
AVG FAMILY SIZE
2.4
AVG HOUSEHOLD SIZE
1,720
LABOR FORCE [ PEOPLE ]
47.0%
PERCENT IN LABOR FORCE
4.1%
UNEMPLOYMENT RATE
Income in Lincoln County
Income Overview in Lincoln County
Per Capita Income in Lincoln County is $32,459, while median incomes of families and households are $85,950 and $67,412 respectively.
| Characteristic | Number | Measure |
| Per Capita Income | 4,507 | $32,459 |
| Median Family Income | 1,009 | $85,950 |
| Mean Family Income | 1,009 | $94,631 |
| Median Household Income | 1,645 | $67,412 |
| Mean Household Income | 1,645 | $81,163 |
| Income Deficit | 1,009 | $14,991 |
| Wage / Income Gap (%) | 4,507 | 35.57% |
| Wage / Income Gap ($) | 4,507 | 64.43¢ per $1 |
| Gini / Inequality Index | 4,507 | 0.38 |
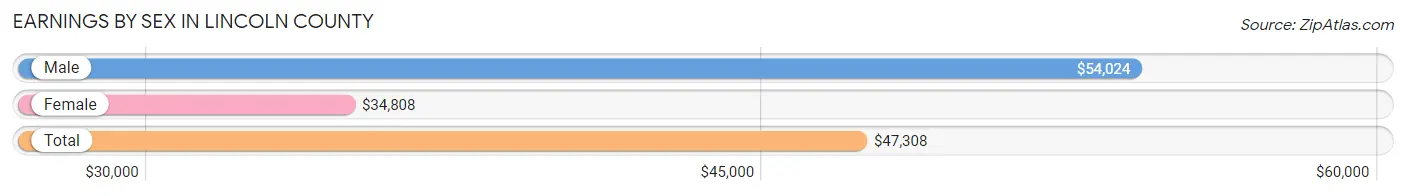
Earnings by Sex in Lincoln County
Average Earnings in Lincoln County are $47,308, $54,024 for men and $34,808 for women, a difference of 35.6%.
| Sex | Number | Average Earnings |
| Male | 1,190 (59.0%) | $54,024 |
| Female | 828 (41.0%) | $34,808 |
| Total | 2,018 (100.0%) | $47,308 |
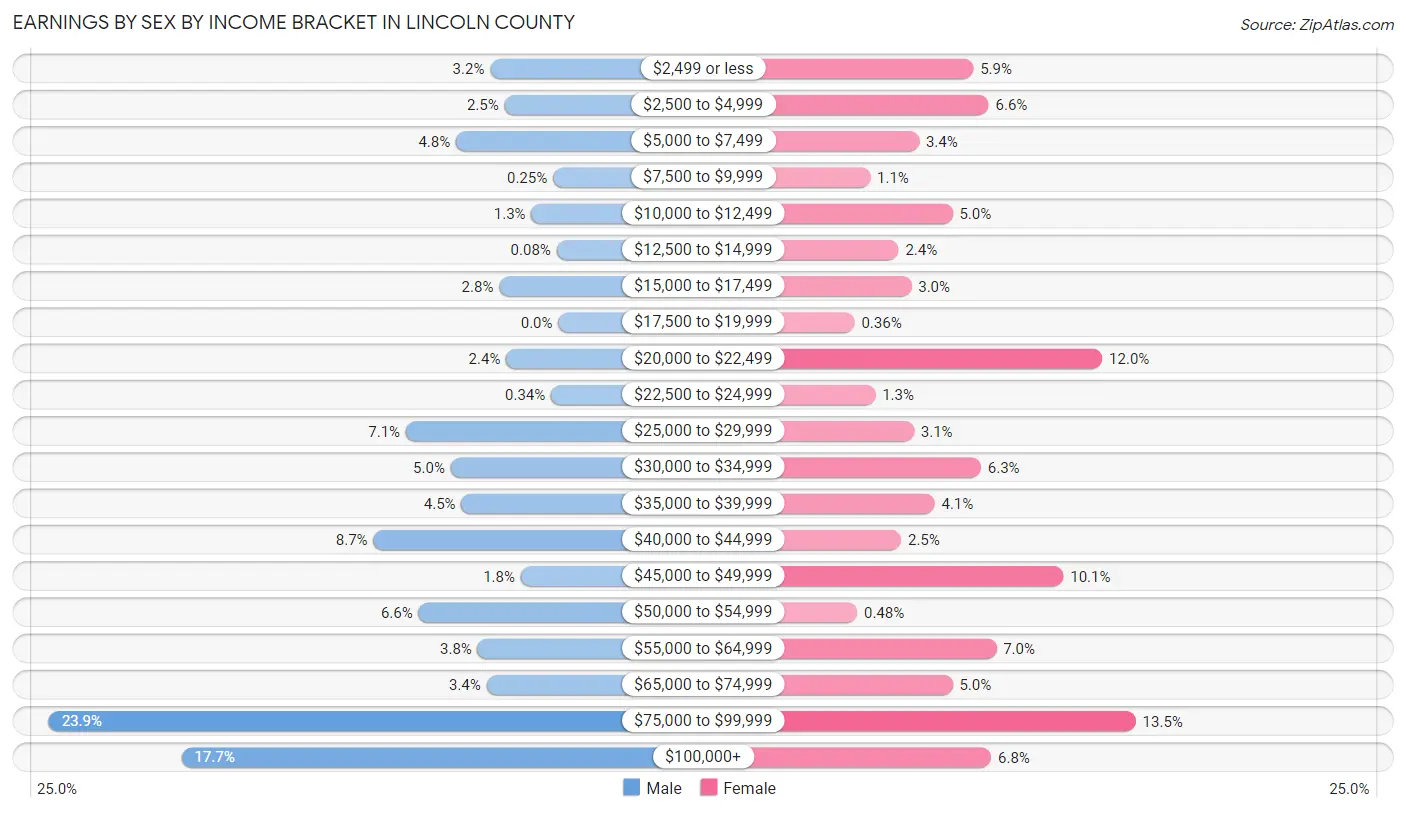
Earnings by Sex by Income Bracket in Lincoln County
The most common earnings brackets in Lincoln County are $75,000 to $99,999 for men (284 | 23.9%) and $75,000 to $99,999 for women (112 | 13.5%).
| Income | Male | Female |
| $2,499 or less | 38 (3.2%) | 49 (5.9%) |
| $2,500 to $4,999 | 30 (2.5%) | 55 (6.6%) |
| $5,000 to $7,499 | 57 (4.8%) | 28 (3.4%) |
| $7,500 to $9,999 | 3 (0.3%) | 9 (1.1%) |
| $10,000 to $12,499 | 15 (1.3%) | 41 (5.0%) |
| $12,500 to $14,999 | 1 (0.1%) | 20 (2.4%) |
| $15,000 to $17,499 | 33 (2.8%) | 25 (3.0%) |
| $17,500 to $19,999 | 0 (0.0%) | 3 (0.4%) |
| $20,000 to $22,499 | 29 (2.4%) | 99 (12.0%) |
| $22,500 to $24,999 | 4 (0.3%) | 11 (1.3%) |
| $25,000 to $29,999 | 85 (7.1%) | 26 (3.1%) |
| $30,000 to $34,999 | 60 (5.0%) | 52 (6.3%) |
| $35,000 to $39,999 | 54 (4.5%) | 34 (4.1%) |
| $40,000 to $44,999 | 103 (8.7%) | 21 (2.5%) |
| $45,000 to $49,999 | 21 (1.8%) | 84 (10.1%) |
| $50,000 to $54,999 | 78 (6.6%) | 4 (0.5%) |
| $55,000 to $64,999 | 45 (3.8%) | 58 (7.0%) |
| $65,000 to $74,999 | 40 (3.4%) | 41 (5.0%) |
| $75,000 to $99,999 | 284 (23.9%) | 112 (13.5%) |
| $100,000+ | 210 (17.6%) | 56 (6.8%) |
| Total | 1,190 (100.0%) | 828 (100.0%) |
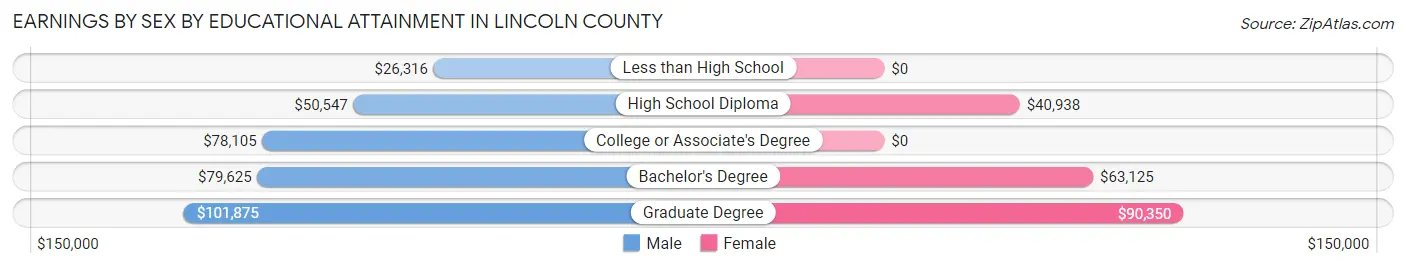
Earnings by Sex by Educational Attainment in Lincoln County
Average earnings in Lincoln County are $64,674 for men and $47,629 for women, a difference of 26.4%. Men with an educational attainment of graduate degree enjoy the highest average annual earnings of $101,875, while those with less than high school education earn the least with $26,316. Women with an educational attainment of graduate degree earn the most with the average annual earnings of $90,350, while those with high school diploma education have the smallest earnings of $40,938.
| Educational Attainment | Male Income | Female Income |
| Less than High School | $26,316 | $0 |
| High School Diploma | $50,547 | $40,938 |
| College or Associate's Degree | $78,105 | $0 |
| Bachelor's Degree | $79,625 | $63,125 |
| Graduate Degree | $101,875 | $90,350 |
| Total | $64,674 | $47,629 |
Family Income in Lincoln County
Family Income Brackets in Lincoln County
According to the Lincoln County family income data, there are 255 families falling into the $100,000 to $149,999 income range, which is the most common income bracket and makes up 25.3% of all families.
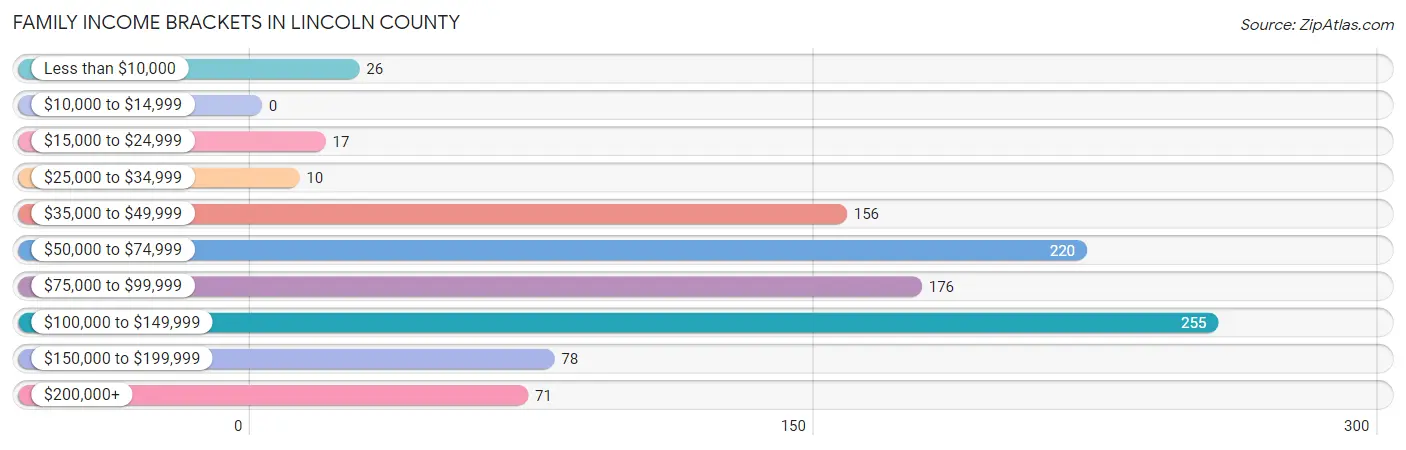
| Income Bracket | # Families | % Families |
| Less than $10,000 | 26 | 2.6% |
| $10,000 to $14,999 | 0 | 0.0% |
| $15,000 to $24,999 | 17 | 1.7% |
| $25,000 to $34,999 | 10 | 1.0% |
| $35,000 to $49,999 | 156 | 15.5% |
| $50,000 to $74,999 | 220 | 21.8% |
| $75,000 to $99,999 | 176 | 17.4% |
| $100,000 to $149,999 | 255 | 25.3% |
| $150,000 to $199,999 | 78 | 7.7% |
| $200,000+ | 71 | 7.0% |
Family Income by Famaliy Size in Lincoln County
4-person families (174 | 17.2%) account for the highest median family income in Lincoln County with $106,742 per family, while 2-person families (516 | 51.1%) have the highest median income of $41,875 per family member.
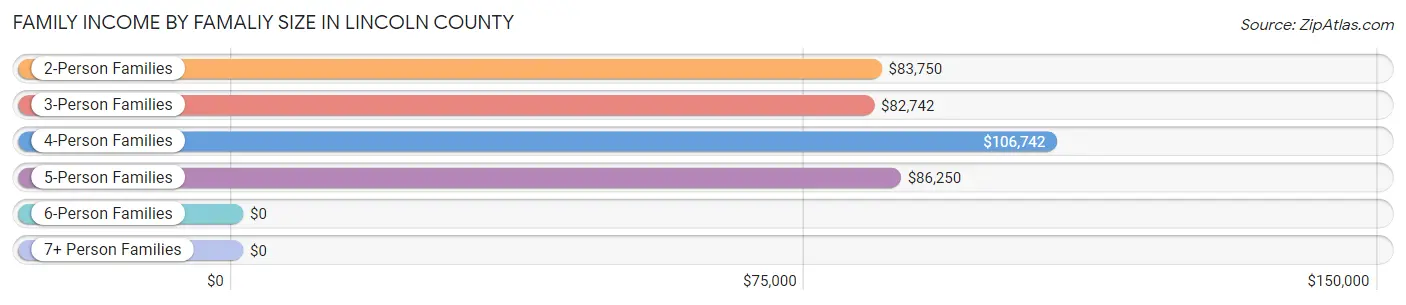
| Income Bracket | # Families | Median Income |
| 2-Person Families | 516 (51.1%) | $83,750 |
| 3-Person Families | 208 (20.6%) | $82,742 |
| 4-Person Families | 174 (17.2%) | $106,742 |
| 5-Person Families | 62 (6.1%) | $86,250 |
| 6-Person Families | 0 (0.0%) | $0 |
| 7+ Person Families | 49 (4.9%) | $0 |
| Total | 1,009 (100.0%) | $85,950 |
Family Income by Number of Earners in Lincoln County
The median family income in Lincoln County is $85,950, with families comprising 3+ earners (75) having the highest median family income of $174,205, while families with no earners (184) have the lowest median family income of $55,625, accounting for 7.4% and 18.2% of families, respectively.
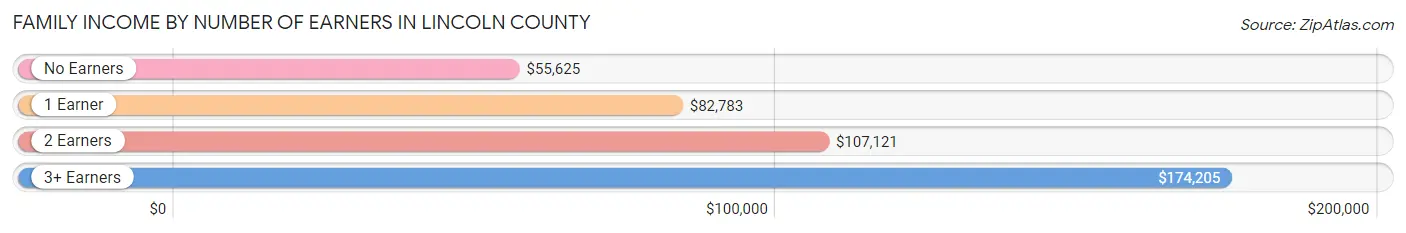
| Number of Earners | # Families | Median Income |
| No Earners | 184 (18.2%) | $55,625 |
| 1 Earner | 444 (44.0%) | $82,783 |
| 2 Earners | 306 (30.3%) | $107,121 |
| 3+ Earners | 75 (7.4%) | $174,205 |
| Total | 1,009 (100.0%) | $85,950 |
Household Income in Lincoln County
Household Income Brackets in Lincoln County
With 377 households falling in the category, the $50,000 to $74,999 income range is the most frequent in Lincoln County, accounting for 22.9% of all households. In contrast, only 8 households (0.5%) fall into the $10,000 to $14,999 income bracket, making it the least populous group.
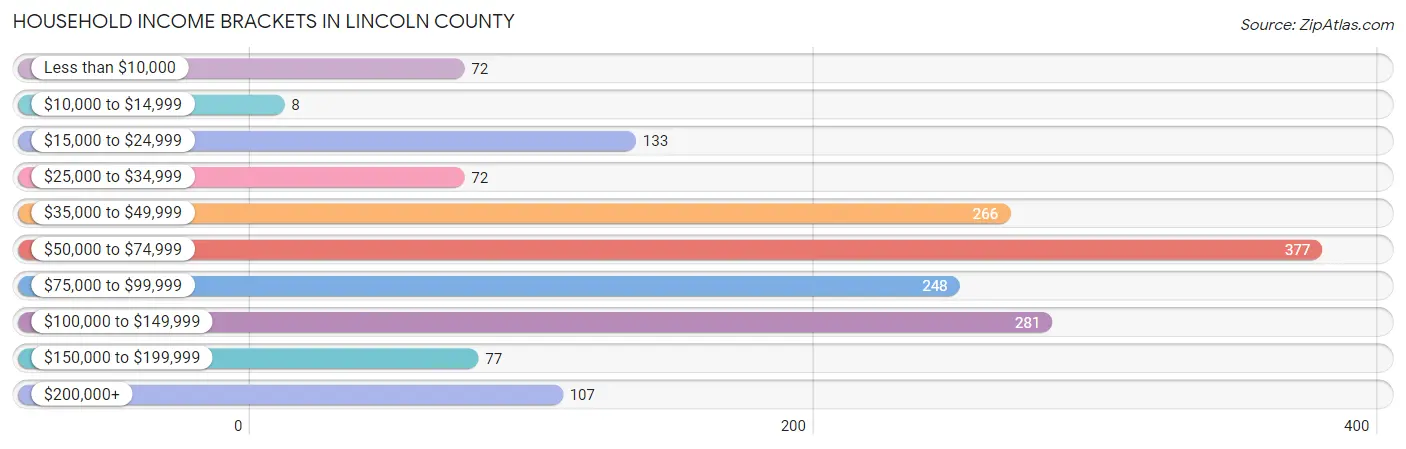
| Income Bracket | # Households | % Households |
| Less than $10,000 | 72 | 4.4% |
| $10,000 to $14,999 | 8 | 0.5% |
| $15,000 to $24,999 | 133 | 8.1% |
| $25,000 to $34,999 | 72 | 4.4% |
| $35,000 to $49,999 | 266 | 16.2% |
| $50,000 to $74,999 | 377 | 22.9% |
| $75,000 to $99,999 | 248 | 15.1% |
| $100,000 to $149,999 | 281 | 17.1% |
| $150,000 to $199,999 | 77 | 4.7% |
| $200,000+ | 107 | 6.5% |
Household Income by Householder Age in Lincoln County
The median household income in Lincoln County is $67,412, with the highest median household income of $84,603 found in the 45 to 64 years age bracket for the primary householder. A total of 756 households (46.0%) fall into this category. Meanwhile, the 15 to 24 years age bracket for the primary householder has the lowest median household income of $0, with 30 households (1.8%) in this group.
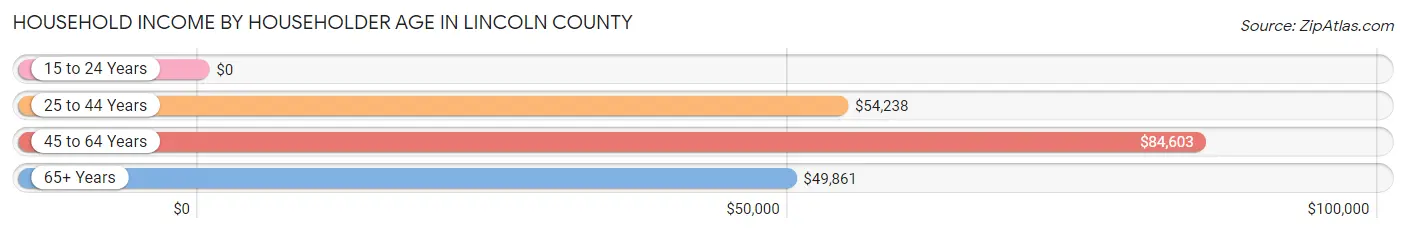
| Income Bracket | # Households | Median Income |
| 15 to 24 Years | 30 (1.8%) | $0 |
| 25 to 44 Years | 415 (25.2%) | $54,238 |
| 45 to 64 Years | 756 (46.0%) | $84,603 |
| 65+ Years | 444 (27.0%) | $49,861 |
| Total | 1,645 (100.0%) | $67,412 |
Poverty in Lincoln County
Income Below Poverty by Sex and Age in Lincoln County
With 4.0% poverty level for males and 10.5% for females among the residents of Lincoln County, 6 to 11 year old males and under 5 year old females are the most vulnerable to poverty, with 23 males (16.0%) and 23 females (24.5%) in their respective age groups living below the poverty level.
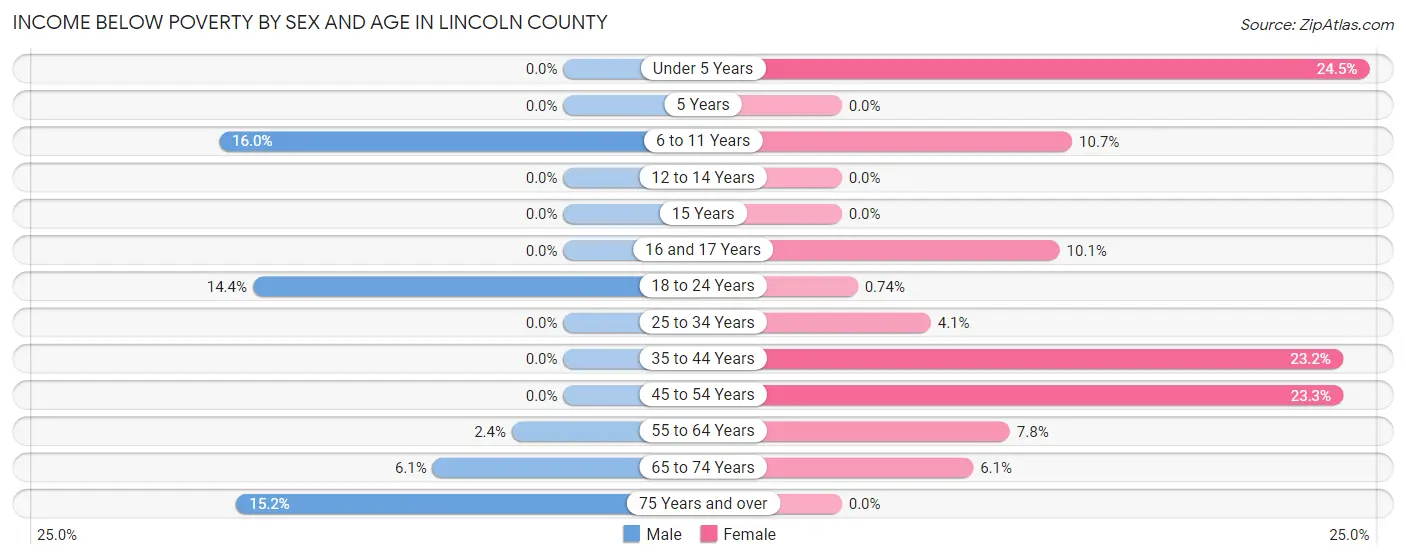
| Age Bracket | Male | Female |
| Under 5 Years | 0 (0.0%) | 23 (24.5%) |
| 5 Years | 0 (0.0%) | 0 (0.0%) |
| 6 to 11 Years | 23 (16.0%) | 14 (10.7%) |
| 12 to 14 Years | 0 (0.0%) | 0 (0.0%) |
| 15 Years | 0 (0.0%) | 0 (0.0%) |
| 16 and 17 Years | 0 (0.0%) | 9 (10.1%) |
| 18 to 24 Years | 16 (14.4%) | 1 (0.7%) |
| 25 to 34 Years | 0 (0.0%) | 10 (4.1%) |
| 35 to 44 Years | 0 (0.0%) | 43 (23.2%) |
| 45 to 54 Years | 0 (0.0%) | 73 (23.3%) |
| 55 to 64 Years | 9 (2.4%) | 22 (7.8%) |
| 65 to 74 Years | 13 (6.1%) | 10 (6.1%) |
| 75 Years and over | 22 (15.2%) | 0 (0.0%) |
| Total | 83 (4.0%) | 205 (10.5%) |
Income Above Poverty by Sex and Age in Lincoln County
According to the poverty statistics in Lincoln County, males aged under 5 years and females aged 5 years are the age groups that are most secure financially, with 100.0% of males and 100.0% of females in these age groups living above the poverty line.
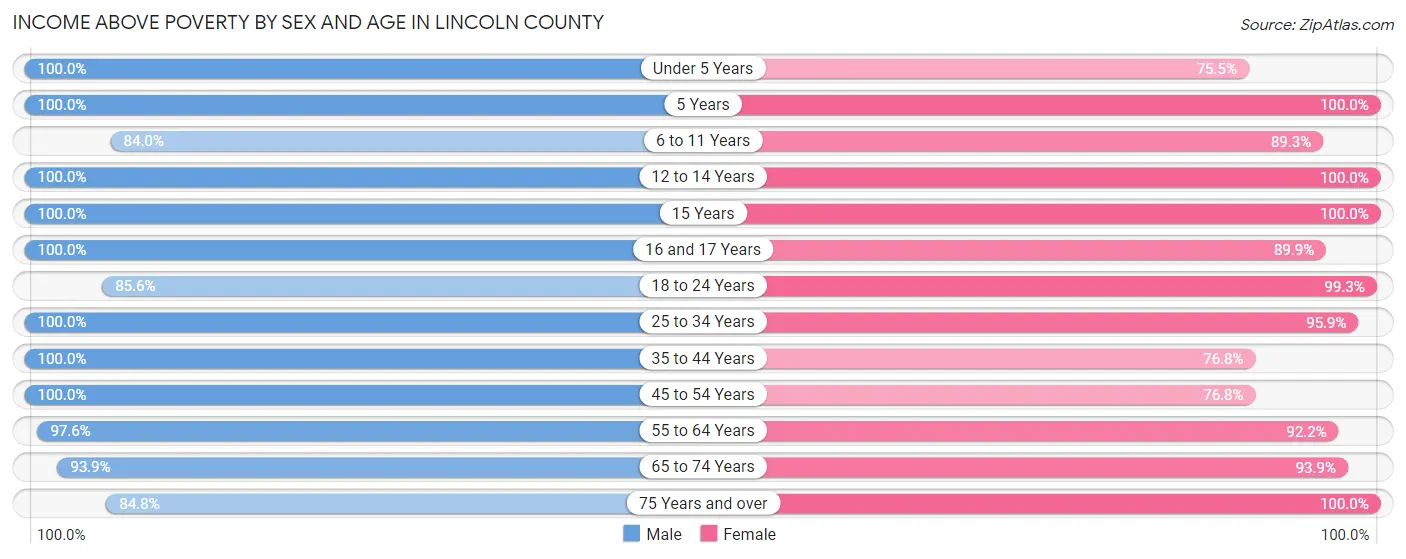
| Age Bracket | Male | Female |
| Under 5 Years | 92 (100.0%) | 71 (75.5%) |
| 5 Years | 33 (100.0%) | 23 (100.0%) |
| 6 to 11 Years | 121 (84.0%) | 117 (89.3%) |
| 12 to 14 Years | 213 (100.0%) | 66 (100.0%) |
| 15 Years | 7 (100.0%) | 30 (100.0%) |
| 16 and 17 Years | 29 (100.0%) | 80 (89.9%) |
| 18 to 24 Years | 95 (85.6%) | 135 (99.3%) |
| 25 to 34 Years | 125 (100.0%) | 232 (95.9%) |
| 35 to 44 Years | 296 (100.0%) | 142 (76.8%) |
| 45 to 54 Years | 280 (100.0%) | 241 (76.7%) |
| 55 to 64 Years | 368 (97.6%) | 260 (92.2%) |
| 65 to 74 Years | 201 (93.9%) | 154 (93.9%) |
| 75 Years and over | 123 (84.8%) | 187 (100.0%) |
| Total | 1,983 (96.0%) | 1,738 (89.4%) |
Income Below Poverty Among Married-Couple Families in Lincoln County
| Children | Above Poverty | Below Poverty |
| No Children | 432 (100.0%) | 0 (0.0%) |
| 1 or 2 Children | 264 (100.0%) | 0 (0.0%) |
| 3 or 4 Children | 7 (100.0%) | 0 (0.0%) |
| 5 or more Children | 49 (100.0%) | 0 (0.0%) |
| Total | 752 (100.0%) | 0 (0.0%) |
Income Below Poverty Among Single-Parent Households in Lincoln County
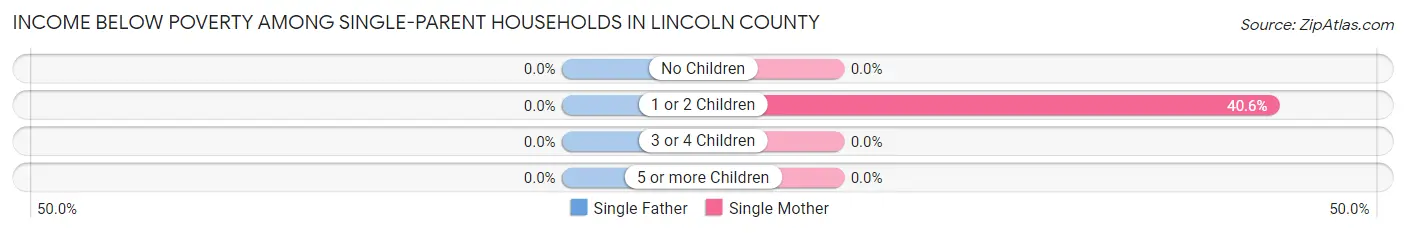
| Children | Single Father | Single Mother |
| No Children | 0 (0.0%) | 0 (0.0%) |
| 1 or 2 Children | 0 (0.0%) | 43 (40.6%) |
| 3 or 4 Children | 0 (0.0%) | 0 (0.0%) |
| 5 or more Children | 0 (0.0%) | 0 (0.0%) |
| Total | 0 (0.0%) | 43 (33.9%) |
Income Below Poverty Among Married-Couple vs Single-Parent Households in Lincoln County
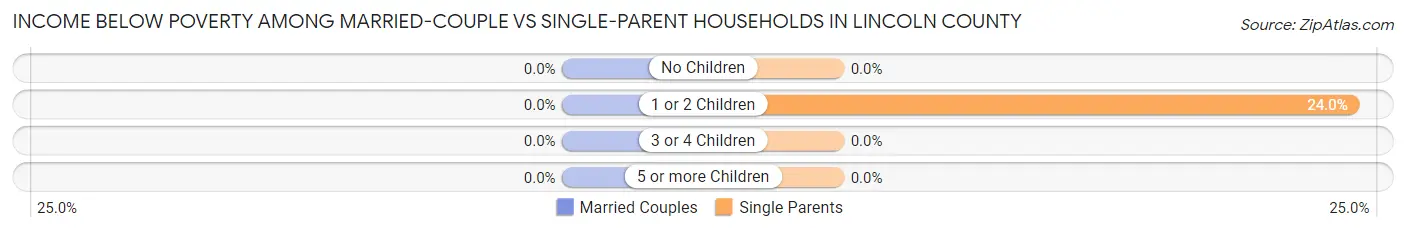
| Children | Married-Couple Families | Single-Parent Households |
| No Children | 0 (0.0%) | 0 (0.0%) |
| 1 or 2 Children | 0 (0.0%) | 43 (24.0%) |
| 3 or 4 Children | 0 (0.0%) | 0 (0.0%) |
| 5 or more Children | 0 (0.0%) | 0 (0.0%) |
| Total | 0 (0.0%) | 43 (16.7%) |
Race in Lincoln County
The most populous races in Lincoln County are White / Caucasian (3,808 | 84.5%), Hispanic or Latino (330 | 7.3%), and Two or more Races (271 | 6.0%).
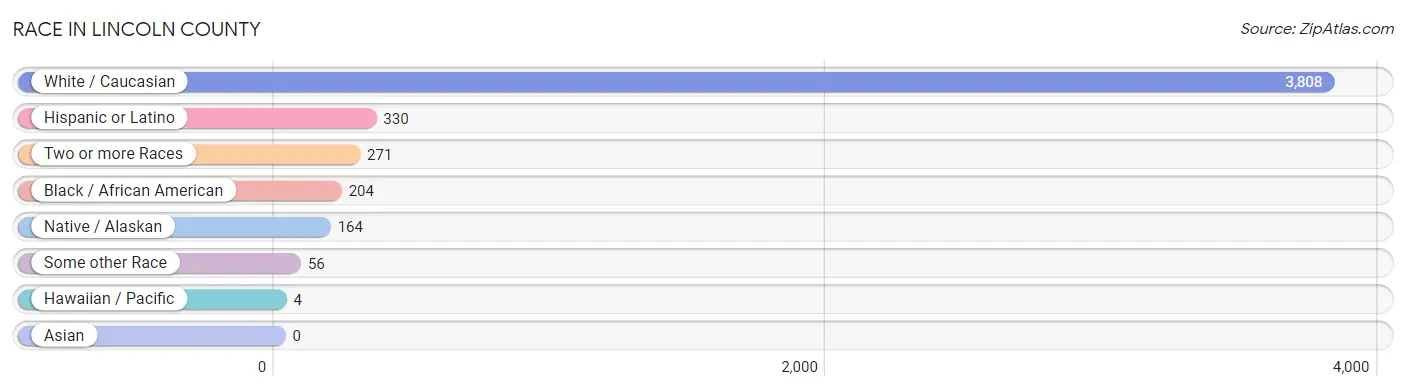
| Race | # Population | % Population |
| Asian | 0 | 0.0% |
| Black / African American | 204 | 4.5% |
| Hawaiian / Pacific | 4 | 0.1% |
| Hispanic or Latino | 330 | 7.3% |
| Native / Alaskan | 164 | 3.6% |
| White / Caucasian | 3,808 | 84.5% |
| Two or more Races | 271 | 6.0% |
| Some other Race | 56 | 1.2% |
| Total | 4,507 | 100.0% |
Ancestry in Lincoln County
The most populous ancestries reported in Lincoln County are German (725 | 16.1%), English (703 | 15.6%), Irish (514 | 11.4%), Mexican (302 | 6.7%), and Italian (239 | 5.3%), together accounting for 55.1% of all Lincoln County residents.
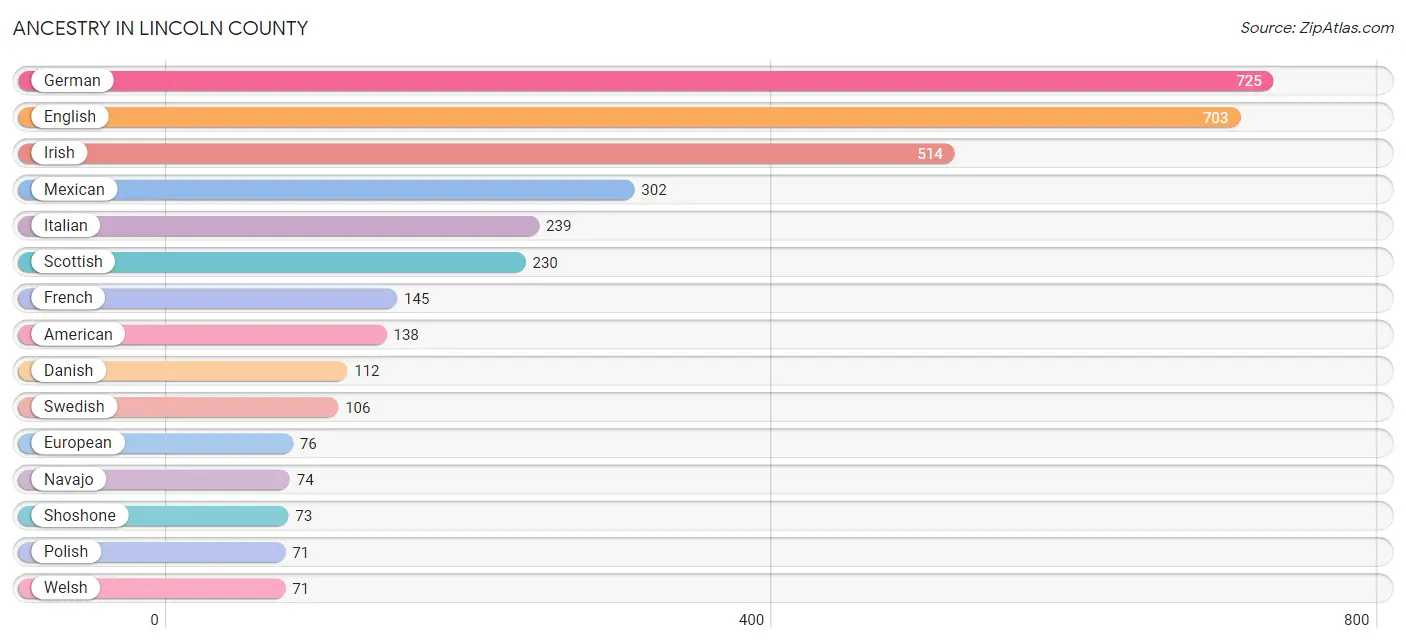
| Ancestry | # Population | % Population |
| African | 3 | 0.1% |
| American | 138 | 3.1% |
| British | 1 | 0.0% |
| Burmese | 1 | 0.0% |
| Canadian | 11 | 0.2% |
| Celtic | 36 | 0.8% |
| Central American | 21 | 0.5% |
| Cuban | 3 | 0.1% |
| Czech | 20 | 0.4% |
| Danish | 112 | 2.5% |
| Dutch | 10 | 0.2% |
| English | 703 | 15.6% |
| European | 76 | 1.7% |
| French | 145 | 3.2% |
| French Canadian | 39 | 0.9% |
| German | 725 | 16.1% |
| Greek | 24 | 0.5% |
| Honduran | 21 | 0.5% |
| Irish | 514 | 11.4% |
| Italian | 239 | 5.3% |
| Jamaican | 1 | 0.0% |
| Korean | 1 | 0.0% |
| Mexican | 302 | 6.7% |
| Native Hawaiian | 9 | 0.2% |
| Navajo | 74 | 1.6% |
| Northern European | 54 | 1.2% |
| Norwegian | 25 | 0.5% |
| Paiute | 13 | 0.3% |
| Polish | 71 | 1.6% |
| Portuguese | 7 | 0.2% |
| Potawatomi | 17 | 0.4% |
| Russian | 54 | 1.2% |
| Samoan | 1 | 0.0% |
| Scandinavian | 65 | 1.4% |
| Scotch-Irish | 25 | 0.5% |
| Scottish | 230 | 5.1% |
| Shoshone | 73 | 1.6% |
| Spaniard | 4 | 0.1% |
| Subsaharan African | 3 | 0.1% |
| Swedish | 106 | 2.4% |
| Swiss | 64 | 1.4% |
| Welsh | 71 | 1.6% |
| Yaqui | 11 | 0.2% | View All 43 Rows |
Immigrants in Lincoln County
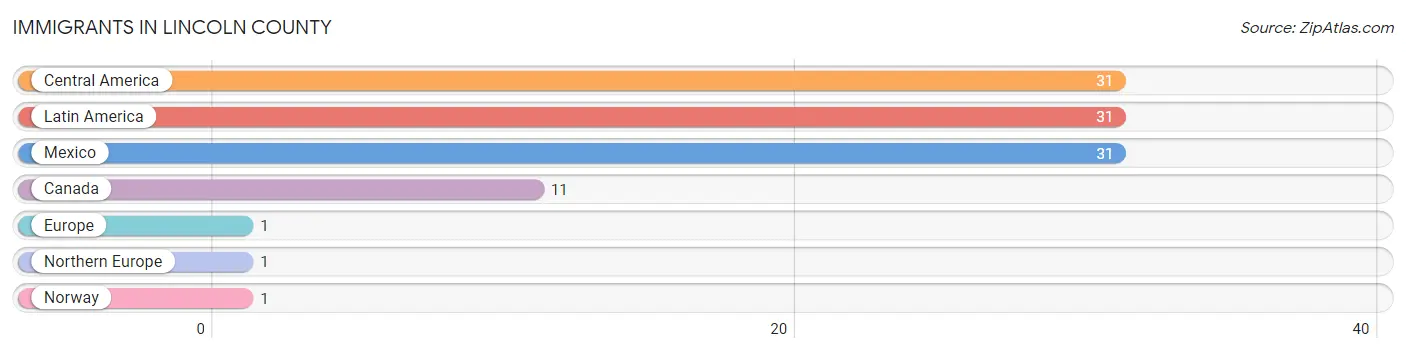
The most numerous immigrant groups reported in Lincoln County came from Central America (31 | 0.7%), Latin America (31 | 0.7%), Mexico (31 | 0.7%), Canada (11 | 0.2%), and Europe (1 | 0.0%), together accounting for 2.3% of all Lincoln County residents.
| Immigration Origin | # Population | % Population |
| Canada | 11 | 0.2% |
| Central America | 31 | 0.7% |
| Europe | 1 | 0.0% |
| Latin America | 31 | 0.7% |
| Mexico | 31 | 0.7% |
| Northern Europe | 1 | 0.0% |
| Norway | 1 | 0.0% | View All 7 Rows |
Sex and Age in Lincoln County
Sex and Age in Lincoln County
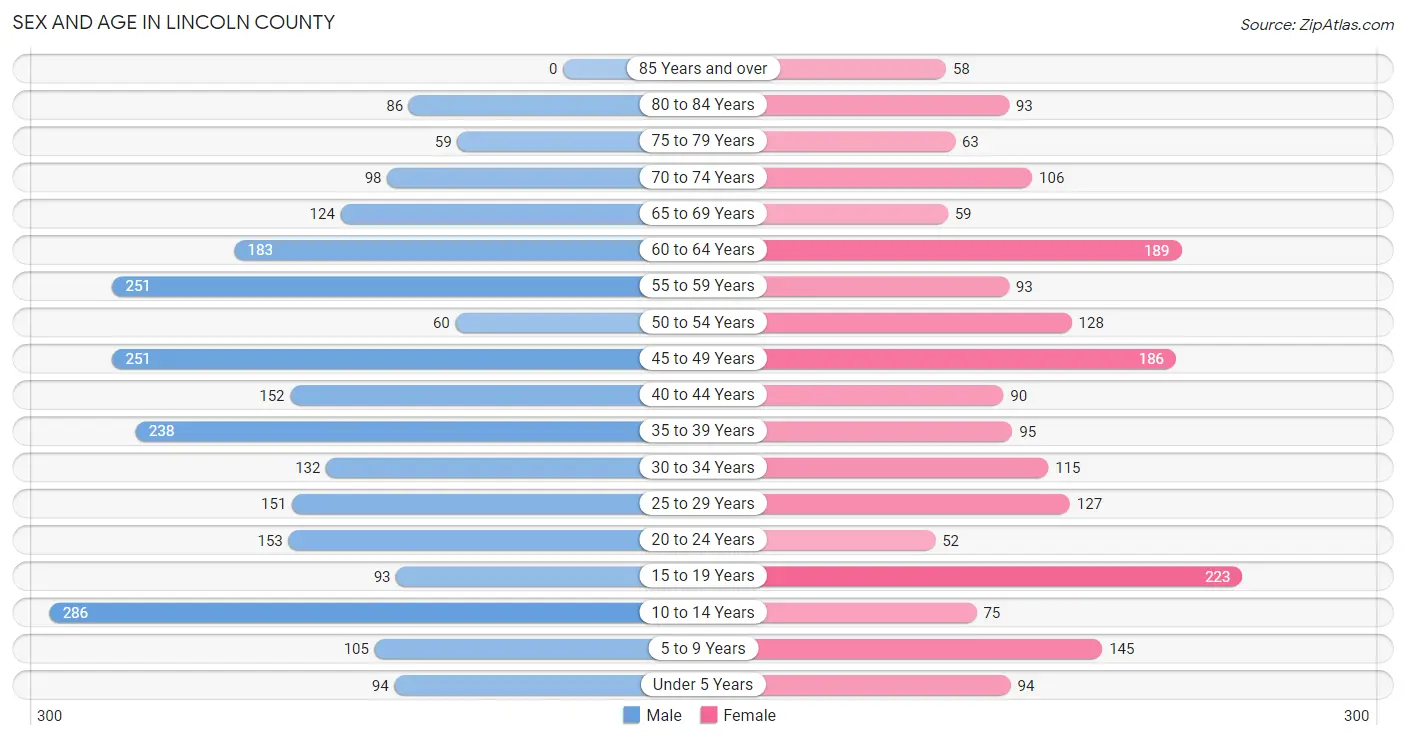
The most populous age groups in Lincoln County are 10 to 14 Years (286 | 11.4%) for men and 15 to 19 Years (223 | 11.2%) for women.
| Age Bracket | Male | Female |
| Under 5 Years | 94 (3.7%) | 94 (4.7%) |
| 5 to 9 Years | 105 (4.2%) | 145 (7.3%) |
| 10 to 14 Years | 286 (11.4%) | 75 (3.8%) |
| 15 to 19 Years | 93 (3.7%) | 223 (11.2%) |
| 20 to 24 Years | 153 (6.1%) | 52 (2.6%) |
| 25 to 29 Years | 151 (6.0%) | 127 (6.4%) |
| 30 to 34 Years | 132 (5.2%) | 115 (5.8%) |
| 35 to 39 Years | 238 (9.5%) | 95 (4.8%) |
| 40 to 44 Years | 152 (6.0%) | 90 (4.5%) |
| 45 to 49 Years | 251 (10.0%) | 186 (9.3%) |
| 50 to 54 Years | 60 (2.4%) | 128 (6.4%) |
| 55 to 59 Years | 251 (10.0%) | 93 (4.7%) |
| 60 to 64 Years | 183 (7.3%) | 189 (9.5%) |
| 65 to 69 Years | 124 (4.9%) | 59 (3.0%) |
| 70 to 74 Years | 98 (3.9%) | 106 (5.3%) |
| 75 to 79 Years | 59 (2.3%) | 63 (3.2%) |
| 80 to 84 Years | 86 (3.4%) | 93 (4.7%) |
| 85 Years and over | 0 (0.0%) | 58 (2.9%) |
| Total | 2,516 (100.0%) | 1,991 (100.0%) |
Families and Households in Lincoln County
Median Family Size in Lincoln County
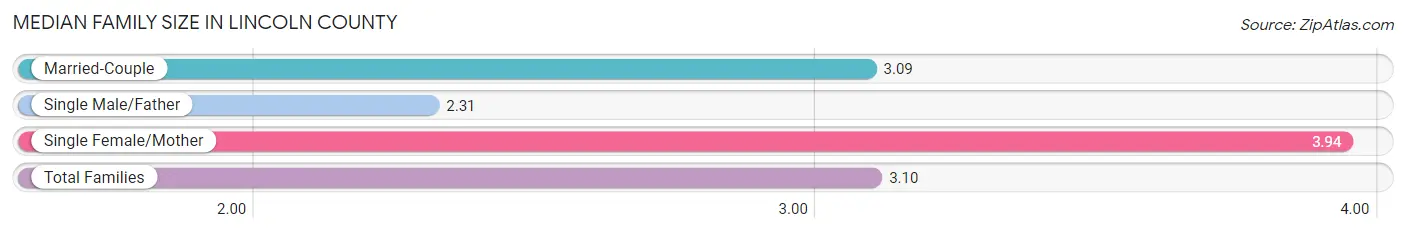
The median family size in Lincoln County is 3.10 persons per family, with single female/mother families (127 | 12.6%) accounting for the largest median family size of 3.94 persons per family. On the other hand, single male/father families (130 | 12.9%) represent the smallest median family size with 2.31 persons per family.
| Family Type | # Families | Family Size |
| Married-Couple | 752 (74.5%) | 3.09 |
| Single Male/Father | 130 (12.9%) | 2.31 |
| Single Female/Mother | 127 (12.6%) | 3.94 |
| Total Families | 1,009 (100.0%) | 3.10 |
Median Household Size in Lincoln County
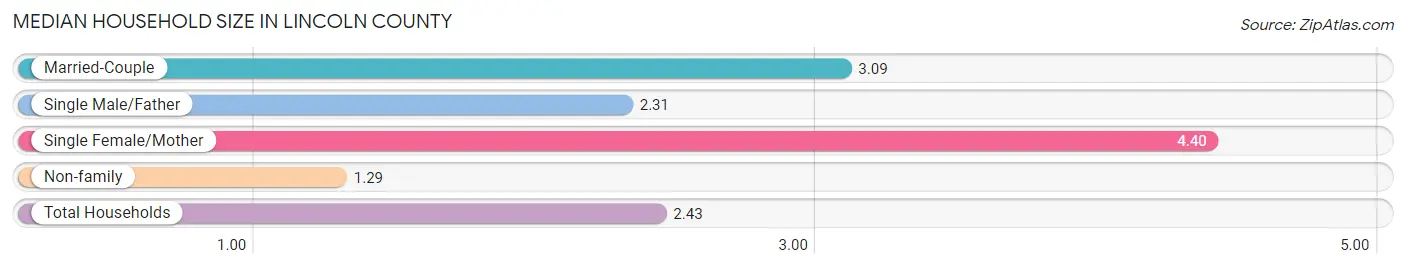
The median household size in Lincoln County is 2.43 persons per household, with single female/mother households (127 | 7.7%) accounting for the largest median household size of 4.4 persons per household. non-family households (636 | 38.7%) represent the smallest median household size with 1.29 persons per household.
| Household Type | # Households | Household Size |
| Married-Couple | 752 (45.7%) | 3.09 |
| Single Male/Father | 130 (7.9%) | 2.31 |
| Single Female/Mother | 127 (7.7%) | 4.40 |
| Non-family | 636 (38.7%) | 1.29 |
| Total Households | 1,645 (100.0%) | 2.43 |
Household Size by Marriage Status in Lincoln County
Out of a total of 1,645 households in Lincoln County, 1,009 (61.3%) are family households, while 636 (38.7%) are nonfamily households. The most numerous type of family households are 2-person households, comprising 490, and the most common type of nonfamily households are 1-person households, comprising 492.
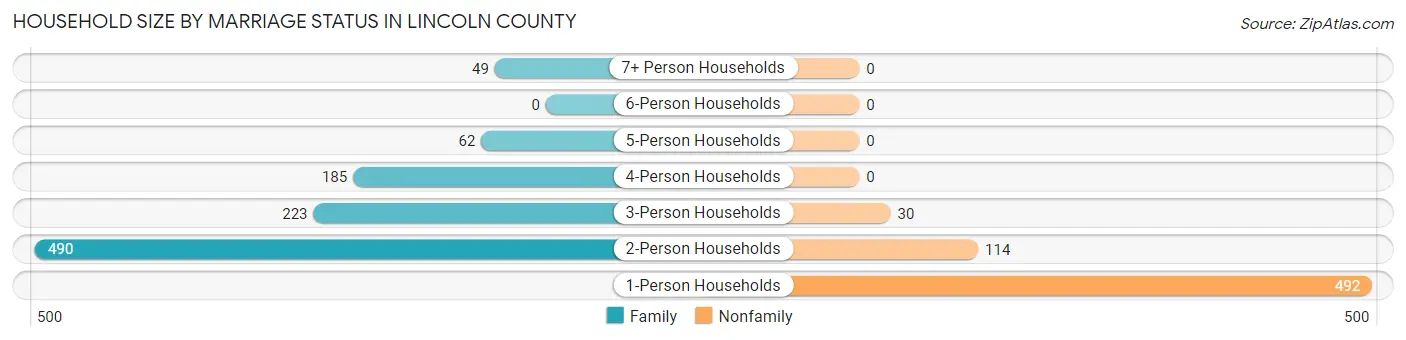
| Household Size | Family Households | Nonfamily Households |
| 1-Person Households | - | 492 (29.9%) |
| 2-Person Households | 490 (29.8%) | 114 (6.9%) |
| 3-Person Households | 223 (13.6%) | 30 (1.8%) |
| 4-Person Households | 185 (11.3%) | 0 (0.0%) |
| 5-Person Households | 62 (3.8%) | 0 (0.0%) |
| 6-Person Households | 0 (0.0%) | 0 (0.0%) |
| 7+ Person Households | 49 (3.0%) | 0 (0.0%) |
| Total | 1,009 (61.3%) | 636 (38.7%) |
Female Fertility in Lincoln County
Fertility by Age in Lincoln County
| Age Bracket | Women with Births | Births / 1,000 Women |
| 15 to 19 years | 0 (0.0%) | 0.0 |
| 20 to 34 years | 0 (0.0%) | 0.0 |
| 35 to 50 years | 0 (0.0%) | 0.0 |
| Total | 0 (0.0%) | 0.0 |
Fertility by Age by Marriage Status in Lincoln County
| Age Bracket | Married | Unmarried |
| 15 to 19 years | 0 (0.0%) | 0 (0.0%) |
| 20 to 34 years | 0 (0.0%) | 0 (0.0%) |
| 35 to 50 years | 0 (0.0%) | 0 (0.0%) |
| Total | 0 (0.0%) | 0 (0.0%) |
Fertility by Education in Lincoln County
| Educational Attainment | Women with Births | Births / 1,000 Women |
| Less than High School | 0 (0.0%) | 0.0 |
| High School Diploma | 0 (0.0%) | 0.0 |
| College or Associate's Degree | 0 (0.0%) | 0.0 |
| Bachelor's Degree | 0 (0.0%) | 0.0 |
| Graduate Degree | 0 (0.0%) | 0.0 |
| Total | 0 (0.0%) | 0.0 |
Fertility by Education by Marriage Status in Lincoln County
| Educational Attainment | Married | Unmarried |
| Less than High School | 0 (0.0%) | 0 (0.0%) |
| High School Diploma | 0 (0.0%) | 0 (0.0%) |
| College or Associate's Degree | 0 (0.0%) | 0 (0.0%) |
| Bachelor's Degree | 0 (0.0%) | 0 (0.0%) |
| Graduate Degree | 0 (0.0%) | 0 (0.0%) |
| Total | 0 (0.0%) | 0 (0.0%) |
Employment Characteristics in Lincoln County
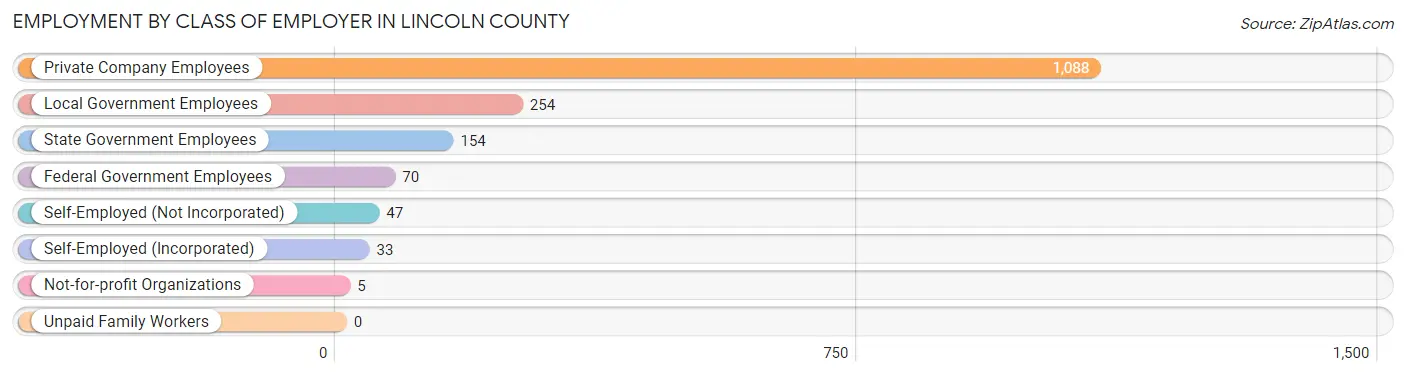
Employment by Class of Employer in Lincoln County
Among the 1,651 employed individuals in Lincoln County, private company employees (1,088 | 65.9%), local government employees (254 | 15.4%), and state government employees (154 | 9.3%) make up the most common classes of employment.
| Employer Class | # Employees | % Employees |
| Private Company Employees | 1,088 | 65.9% |
| Self-Employed (Incorporated) | 33 | 2.0% |
| Self-Employed (Not Incorporated) | 47 | 2.9% |
| Not-for-profit Organizations | 5 | 0.3% |
| Local Government Employees | 254 | 15.4% |
| State Government Employees | 154 | 9.3% |
| Federal Government Employees | 70 | 4.2% |
| Unpaid Family Workers | 0 | 0.0% |
| Total | 1,651 | 100.0% |
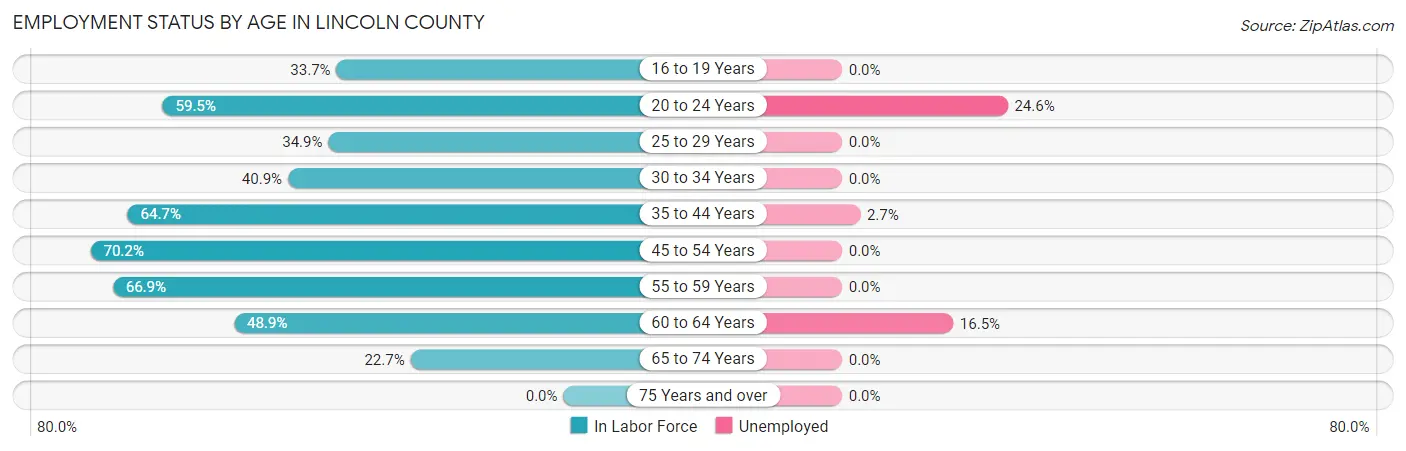
Employment Status by Age in Lincoln County
According to the labor force statistics for Lincoln County, out of the total population over 16 years of age (3,659), 47.0% or 1,720 individuals are in the labor force, with 4.1% or 71 of them unemployed. The age group with the highest labor force participation rate is 45 to 54 years, with 70.2% or 439 individuals in the labor force. Within the labor force, the 20 to 24 years age range has the highest percentage of unemployed individuals, with 24.6% or 30 of them being unemployed.
| Age Bracket | In Labor Force | Unemployed |
| 16 to 19 Years | 90 (33.7%) | 0 (0.0%) |
| 20 to 24 Years | 122 (59.5%) | 30 (24.6%) |
| 25 to 29 Years | 97 (34.9%) | 0 (0.0%) |
| 30 to 34 Years | 101 (40.9%) | 0 (0.0%) |
| 35 to 44 Years | 372 (64.7%) | 10 (2.7%) |
| 45 to 54 Years | 439 (70.2%) | 0 (0.0%) |
| 55 to 59 Years | 230 (66.9%) | 0 (0.0%) |
| 60 to 64 Years | 182 (48.9%) | 30 (16.5%) |
| 65 to 74 Years | 88 (22.7%) | 0 (0.0%) |
| 75 Years and over | 0 (0.0%) | 0 (0.0%) |
| Total | 1,720 (47.0%) | 71 (4.1%) |
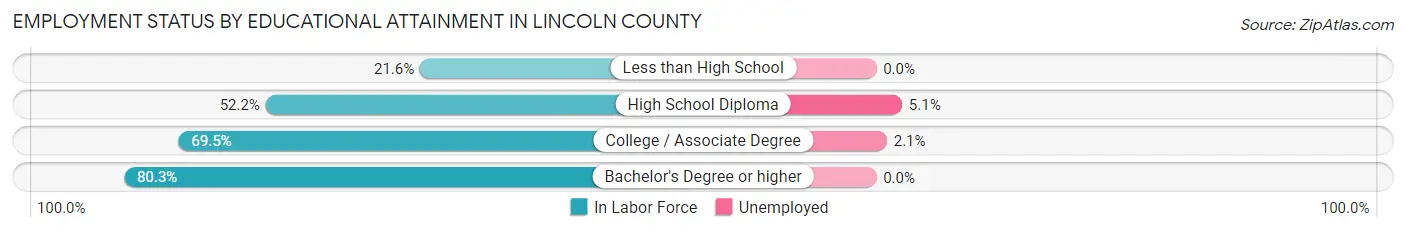
Employment Status by Educational Attainment in Lincoln County
According to labor force statistics for Lincoln County, 58.2% of individuals (1,421) out of the total population between 25 and 64 years of age (2,441) are in the labor force, with 2.8% or 40 of them being unemployed. The group with the highest labor force participation rate are those with the educational attainment of bachelor's degree or higher, with 80.3% or 310 individuals in the labor force. Within the labor force, individuals with high school diploma education have the highest percentage of unemployment, with 5.1% or 30 of them being unemployed.
| Educational Attainment | In Labor Force | Unemployed |
| Less than High School | 56 (21.6%) | 0 (0.0%) |
| High School Diploma | 585 (52.2%) | 57 (5.1%) |
| College / Associate Degree | 470 (69.5%) | 14 (2.1%) |
| Bachelor's Degree or higher | 310 (80.3%) | 0 (0.0%) |
| Total | 1,421 (58.2%) | 68 (2.8%) |
Employment Occupations by Sex in Lincoln County
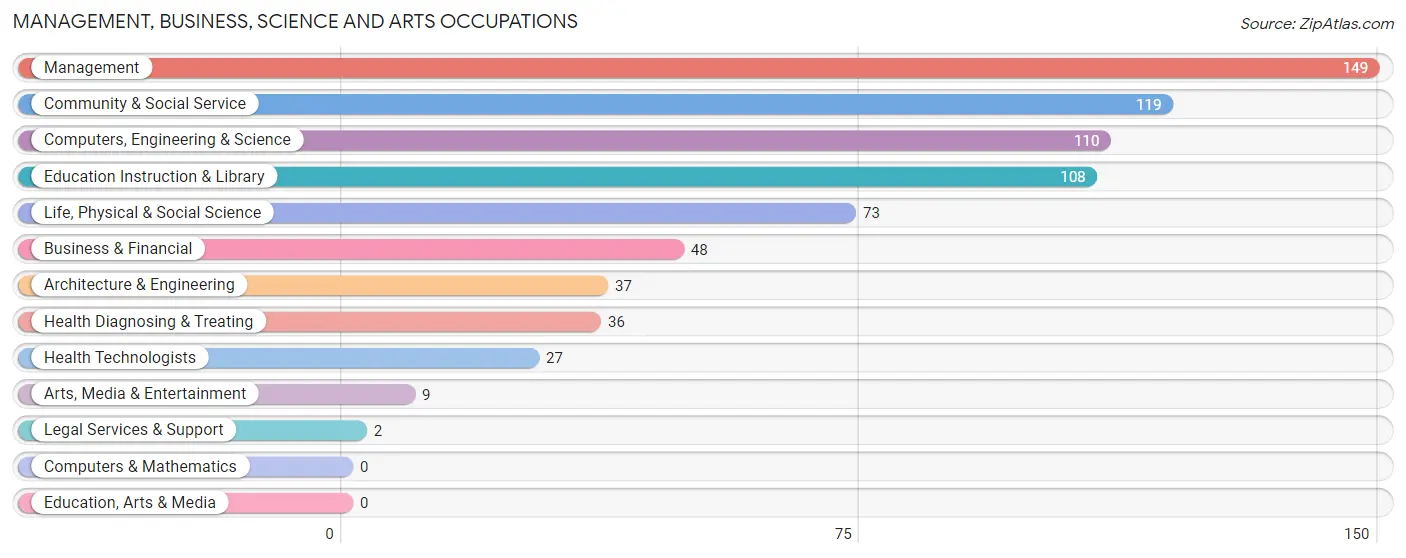
Management, Business, Science and Arts Occupations
The most common Management, Business, Science and Arts occupations in Lincoln County are Management (149 | 9.0%), Community & Social Service (119 | 7.2%), Computers, Engineering & Science (110 | 6.7%), Education Instruction & Library (108 | 6.5%), and Life, Physical & Social Science (73 | 4.4%).
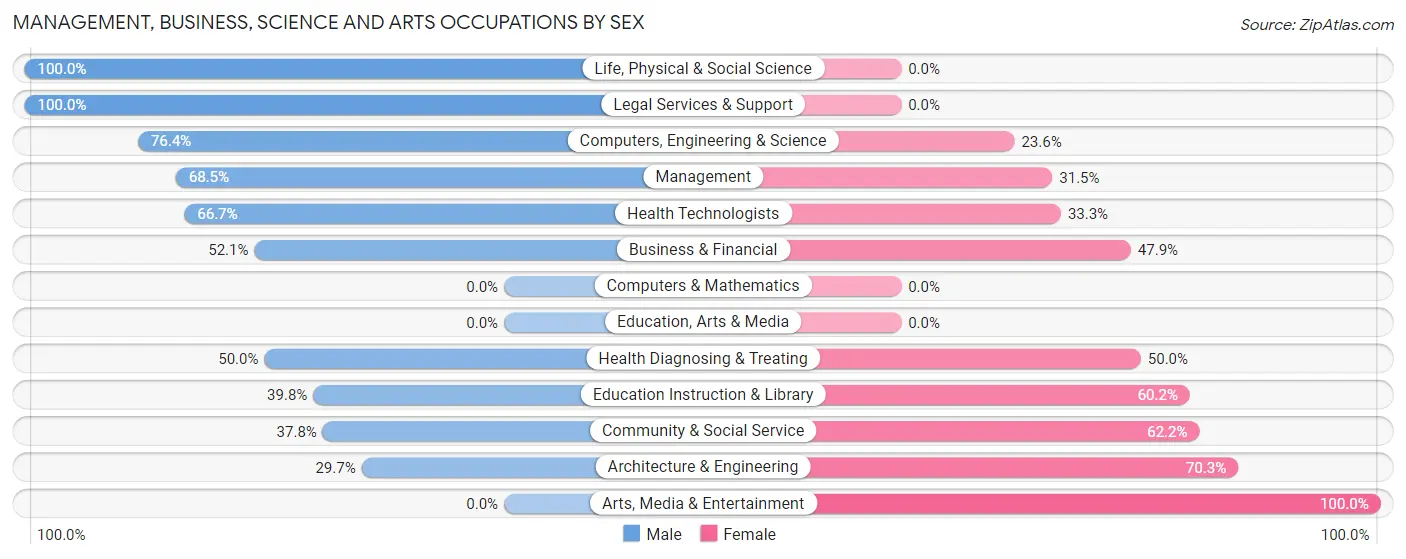
Management, Business, Science and Arts Occupations by Sex
Within the Management, Business, Science and Arts occupations in Lincoln County, the most male-oriented occupations are Life, Physical & Social Science (100.0%), Legal Services & Support (100.0%), and Computers, Engineering & Science (76.4%), while the most female-oriented occupations are Arts, Media & Entertainment (100.0%), Architecture & Engineering (70.3%), and Community & Social Service (62.2%).
| Occupation | Male | Female |
| Management | 102 (68.5%) | 47 (31.5%) |
| Business & Financial | 25 (52.1%) | 23 (47.9%) |
| Computers, Engineering & Science | 84 (76.4%) | 26 (23.6%) |
| Computers & Mathematics | 0 (0.0%) | 0 (0.0%) |
| Architecture & Engineering | 11 (29.7%) | 26 (70.3%) |
| Life, Physical & Social Science | 73 (100.0%) | 0 (0.0%) |
| Community & Social Service | 45 (37.8%) | 74 (62.2%) |
| Education, Arts & Media | 0 (0.0%) | 0 (0.0%) |
| Legal Services & Support | 2 (100.0%) | 0 (0.0%) |
| Education Instruction & Library | 43 (39.8%) | 65 (60.2%) |
| Arts, Media & Entertainment | 0 (0.0%) | 9 (100.0%) |
| Health Diagnosing & Treating | 18 (50.0%) | 18 (50.0%) |
| Health Technologists | 18 (66.7%) | 9 (33.3%) |
| Total (Category) | 274 (59.3%) | 188 (40.7%) |
| Total (Overall) | 991 (60.0%) | 660 (40.0%) |
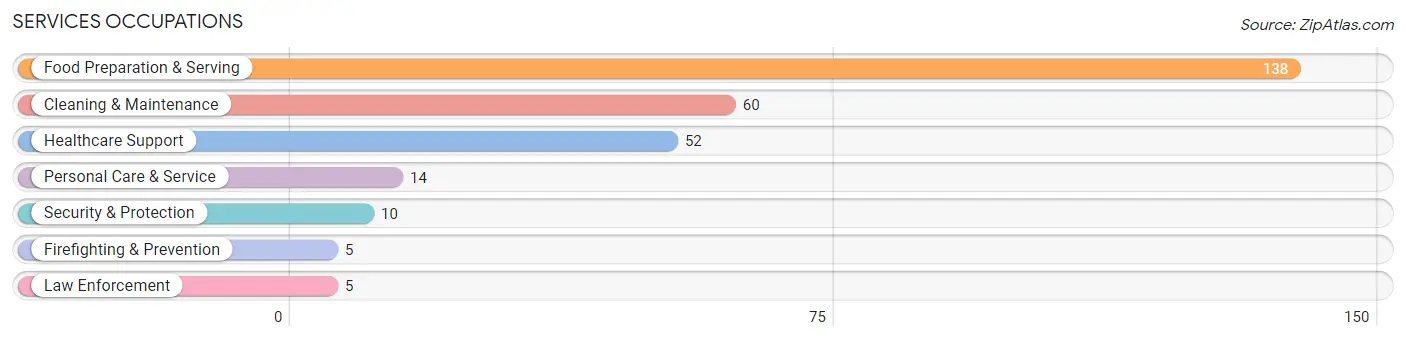
Services Occupations
The most common Services occupations in Lincoln County are Food Preparation & Serving (138 | 8.4%), Cleaning & Maintenance (60 | 3.6%), Healthcare Support (52 | 3.2%), Personal Care & Service (14 | 0.9%), and Security & Protection (10 | 0.6%).
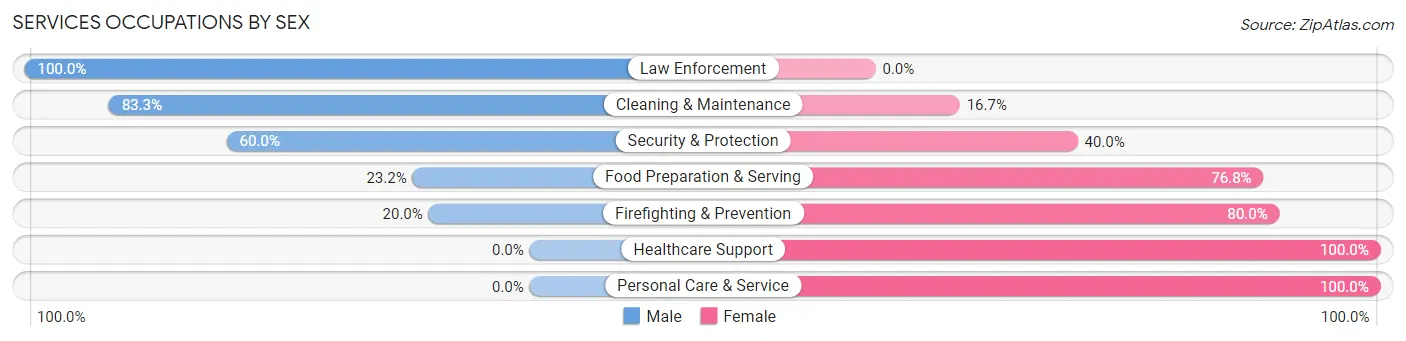
Services Occupations by Sex
Within the Services occupations in Lincoln County, the most male-oriented occupations are Law Enforcement (100.0%), Cleaning & Maintenance (83.3%), and Security & Protection (60.0%), while the most female-oriented occupations are Healthcare Support (100.0%), Personal Care & Service (100.0%), and Firefighting & Prevention (80.0%).
| Occupation | Male | Female |
| Healthcare Support | 0 (0.0%) | 52 (100.0%) |
| Security & Protection | 6 (60.0%) | 4 (40.0%) |
| Firefighting & Prevention | 1 (20.0%) | 4 (80.0%) |
| Law Enforcement | 5 (100.0%) | 0 (0.0%) |
| Food Preparation & Serving | 32 (23.2%) | 106 (76.8%) |
| Cleaning & Maintenance | 50 (83.3%) | 10 (16.7%) |
| Personal Care & Service | 0 (0.0%) | 14 (100.0%) |
| Total (Category) | 88 (32.1%) | 186 (67.9%) |
| Total (Overall) | 991 (60.0%) | 660 (40.0%) |
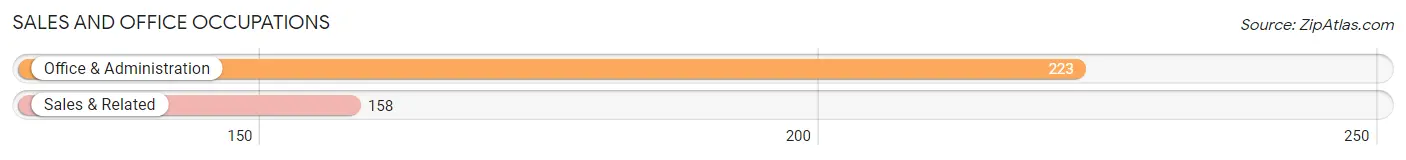
Sales and Office Occupations
The most common Sales and Office occupations in Lincoln County are Office & Administration (223 | 13.5%), and Sales & Related (158 | 9.6%).
Sales and Office Occupations by Sex
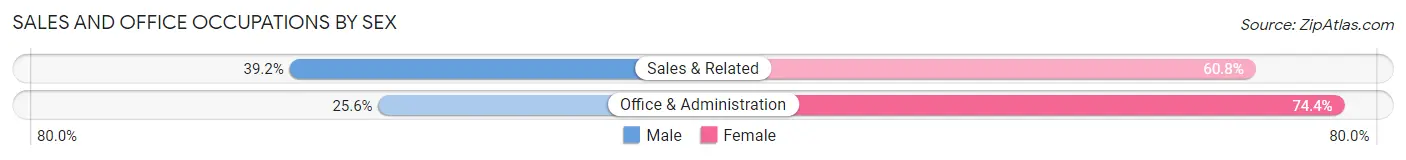
| Occupation | Male | Female |
| Sales & Related | 62 (39.2%) | 96 (60.8%) |
| Office & Administration | 57 (25.6%) | 166 (74.4%) |
| Total (Category) | 119 (31.2%) | 262 (68.8%) |
| Total (Overall) | 991 (60.0%) | 660 (40.0%) |
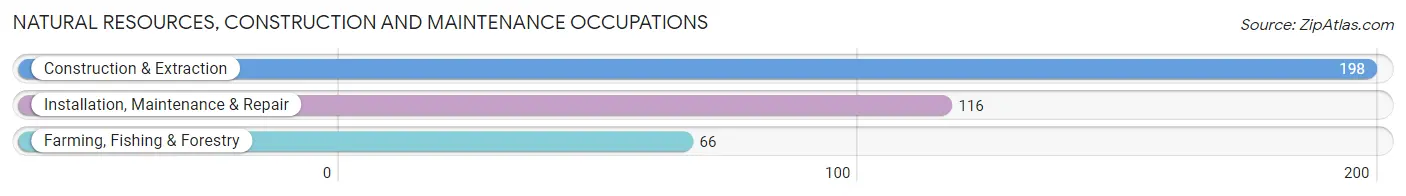
Natural Resources, Construction and Maintenance Occupations
The most common Natural Resources, Construction and Maintenance occupations in Lincoln County are Construction & Extraction (198 | 12.0%), Installation, Maintenance & Repair (116 | 7.0%), and Farming, Fishing & Forestry (66 | 4.0%).
Natural Resources, Construction and Maintenance Occupations by Sex
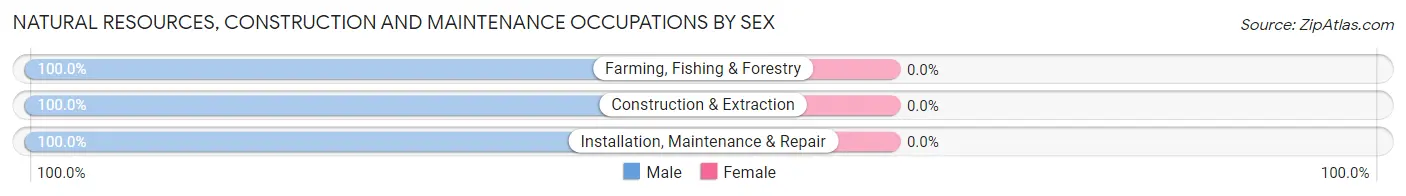
| Occupation | Male | Female |
| Farming, Fishing & Forestry | 66 (100.0%) | 0 (0.0%) |
| Construction & Extraction | 198 (100.0%) | 0 (0.0%) |
| Installation, Maintenance & Repair | 116 (100.0%) | 0 (0.0%) |
| Total (Category) | 380 (100.0%) | 0 (0.0%) |
| Total (Overall) | 991 (60.0%) | 660 (40.0%) |
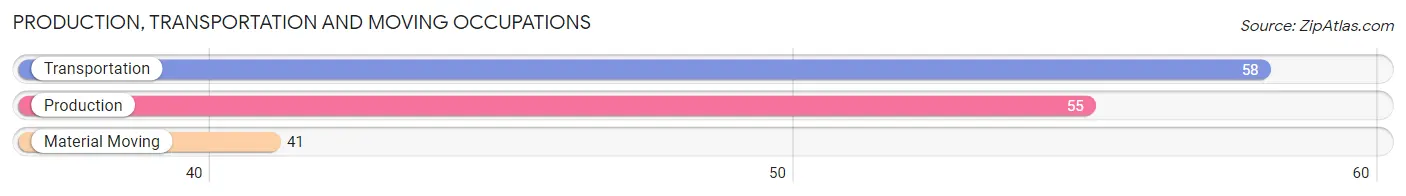
Production, Transportation and Moving Occupations
The most common Production, Transportation and Moving occupations in Lincoln County are Transportation (58 | 3.5%), Production (55 | 3.3%), and Material Moving (41 | 2.5%).
Production, Transportation and Moving Occupations by Sex
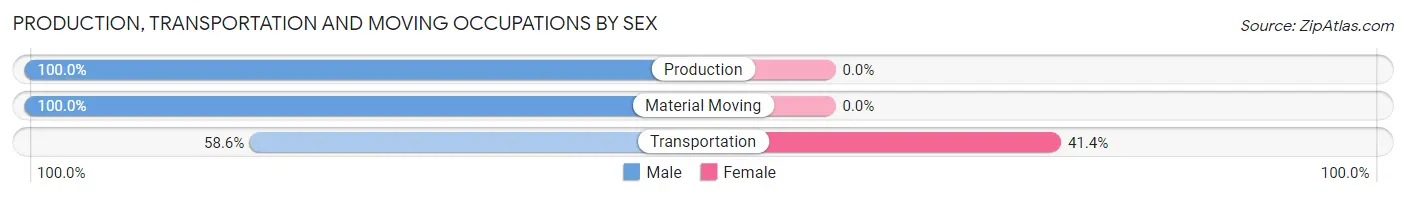
| Occupation | Male | Female |
| Production | 55 (100.0%) | 0 (0.0%) |
| Transportation | 34 (58.6%) | 24 (41.4%) |
| Material Moving | 41 (100.0%) | 0 (0.0%) |
| Total (Category) | 130 (84.4%) | 24 (15.6%) |
| Total (Overall) | 991 (60.0%) | 660 (40.0%) |
Employment Industries by Sex in Lincoln County
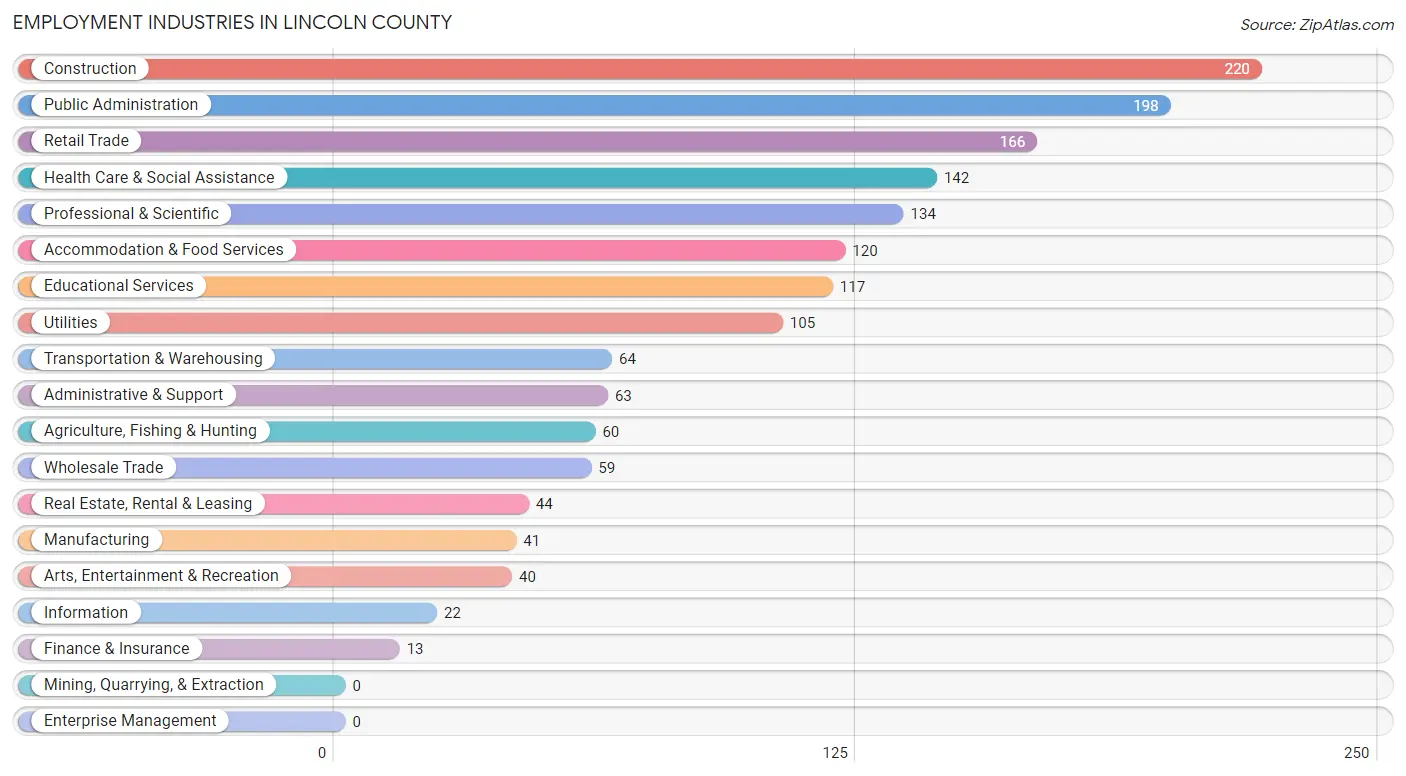
Employment Industries in Lincoln County
The major employment industries in Lincoln County include Construction (220 | 13.3%), Public Administration (198 | 12.0%), Retail Trade (166 | 10.1%), Health Care & Social Assistance (142 | 8.6%), and Professional & Scientific (134 | 8.1%).
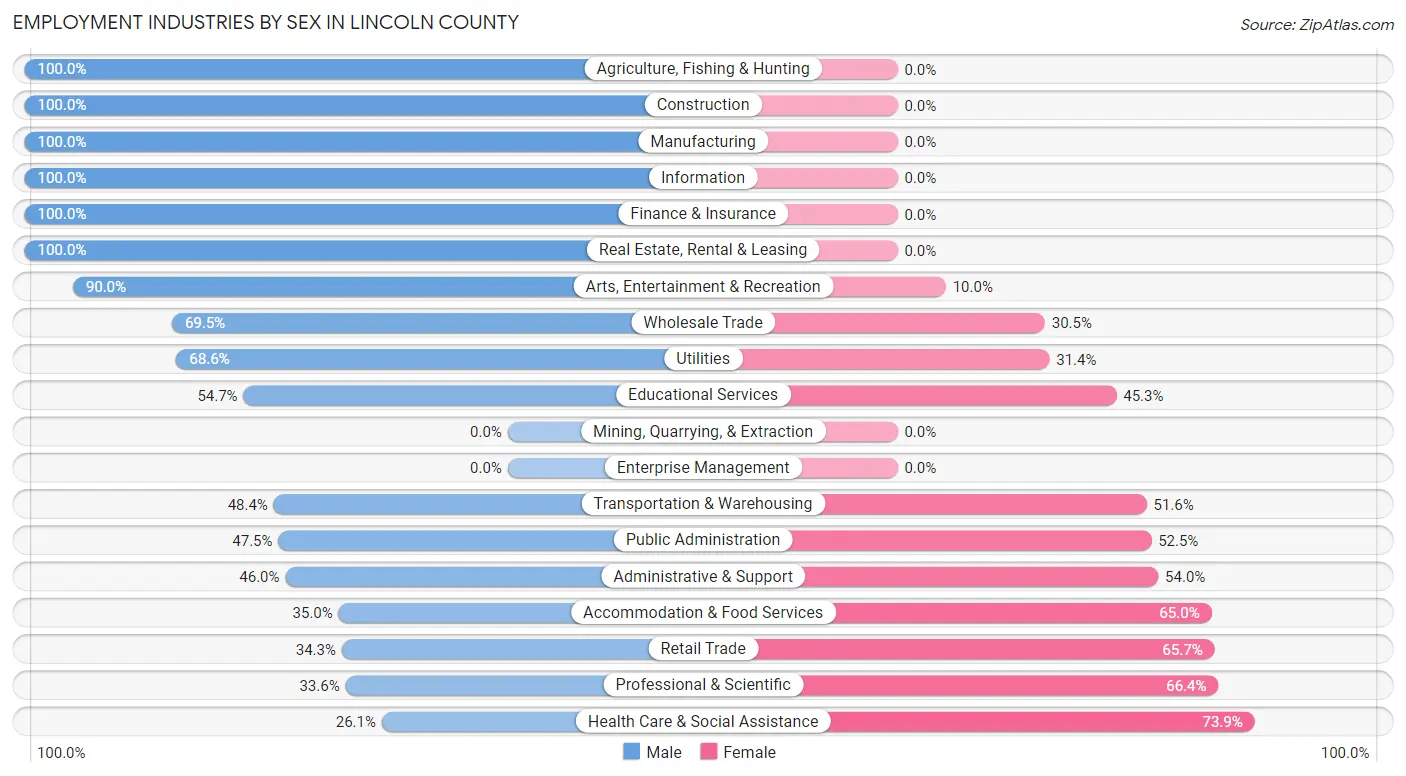
Employment Industries by Sex in Lincoln County
The Lincoln County industries that see more men than women are Agriculture, Fishing & Hunting (100.0%), Construction (100.0%), and Manufacturing (100.0%), whereas the industries that tend to have a higher number of women are Health Care & Social Assistance (73.9%), Professional & Scientific (66.4%), and Retail Trade (65.7%).
| Industry | Male | Female |
| Agriculture, Fishing & Hunting | 60 (100.0%) | 0 (0.0%) |
| Mining, Quarrying, & Extraction | 0 (0.0%) | 0 (0.0%) |
| Construction | 220 (100.0%) | 0 (0.0%) |
| Manufacturing | 41 (100.0%) | 0 (0.0%) |
| Wholesale Trade | 41 (69.5%) | 18 (30.5%) |
| Retail Trade | 57 (34.3%) | 109 (65.7%) |
| Transportation & Warehousing | 31 (48.4%) | 33 (51.6%) |
| Utilities | 72 (68.6%) | 33 (31.4%) |
| Information | 22 (100.0%) | 0 (0.0%) |
| Finance & Insurance | 13 (100.0%) | 0 (0.0%) |
| Real Estate, Rental & Leasing | 44 (100.0%) | 0 (0.0%) |
| Professional & Scientific | 45 (33.6%) | 89 (66.4%) |
| Enterprise Management | 0 (0.0%) | 0 (0.0%) |
| Administrative & Support | 29 (46.0%) | 34 (54.0%) |
| Educational Services | 64 (54.7%) | 53 (45.3%) |
| Health Care & Social Assistance | 37 (26.1%) | 105 (73.9%) |
| Arts, Entertainment & Recreation | 36 (90.0%) | 4 (10.0%) |
| Accommodation & Food Services | 42 (35.0%) | 78 (65.0%) |
| Public Administration | 94 (47.5%) | 104 (52.5%) |
| Total | 991 (60.0%) | 660 (40.0%) |
Education in Lincoln County
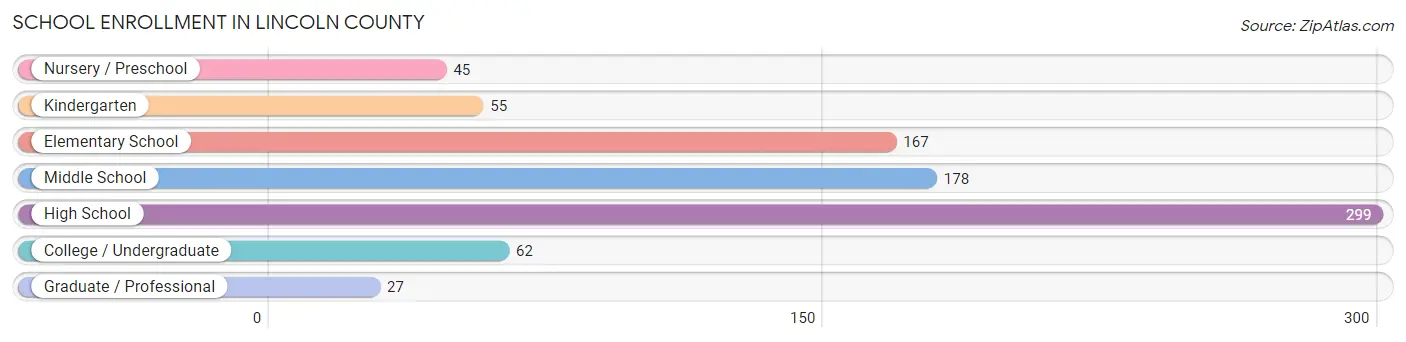
School Enrollment in Lincoln County
The most common levels of schooling among the 833 students in Lincoln County are high school (299 | 35.9%), middle school (178 | 21.4%), and elementary school (167 | 20.1%).
| School Level | # Students | % Students |
| Nursery / Preschool | 45 | 5.4% |
| Kindergarten | 55 | 6.6% |
| Elementary School | 167 | 20.1% |
| Middle School | 178 | 21.4% |
| High School | 299 | 35.9% |
| College / Undergraduate | 62 | 7.4% |
| Graduate / Professional | 27 | 3.2% |
| Total | 833 | 100.0% |
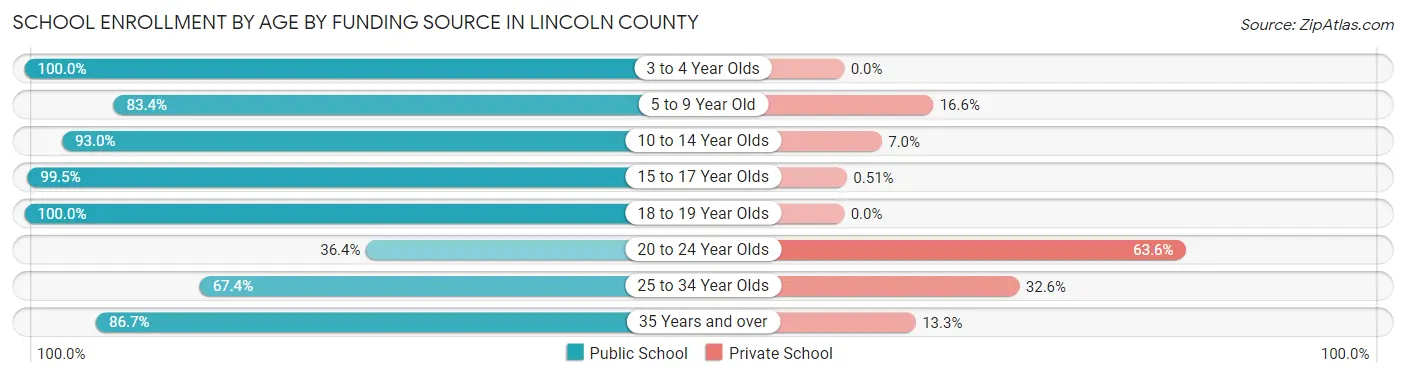
School Enrollment by Age by Funding Source in Lincoln County
Out of a total of 833 students who are enrolled in schools in Lincoln County, 103 (12.4%) attend a private institution, while the remaining 730 (87.6%) are enrolled in public schools. The age group of 20 to 24 year olds has the highest likelihood of being enrolled in private schools, with 14 (63.6% in the age bracket) enrolled. Conversely, the age group of 3 to 4 year olds has the lowest likelihood of being enrolled in a private school, with 22 (100.0% in the age bracket) attending a public institution.
| Age Bracket | Public School | Private School |
| 3 to 4 Year Olds | 22 (100.0%) | 0 (0.0%) |
| 5 to 9 Year Old | 186 (83.4%) | 37 (16.6%) |
| 10 to 14 Year Olds | 186 (93.0%) | 14 (7.0%) |
| 15 to 17 Year Olds | 194 (99.5%) | 1 (0.5%) |
| 18 to 19 Year Olds | 31 (100.0%) | 0 (0.0%) |
| 20 to 24 Year Olds | 8 (36.4%) | 14 (63.6%) |
| 25 to 34 Year Olds | 64 (67.4%) | 31 (32.6%) |
| 35 Years and over | 39 (86.7%) | 6 (13.3%) |
| Total | 730 (87.6%) | 103 (12.4%) |
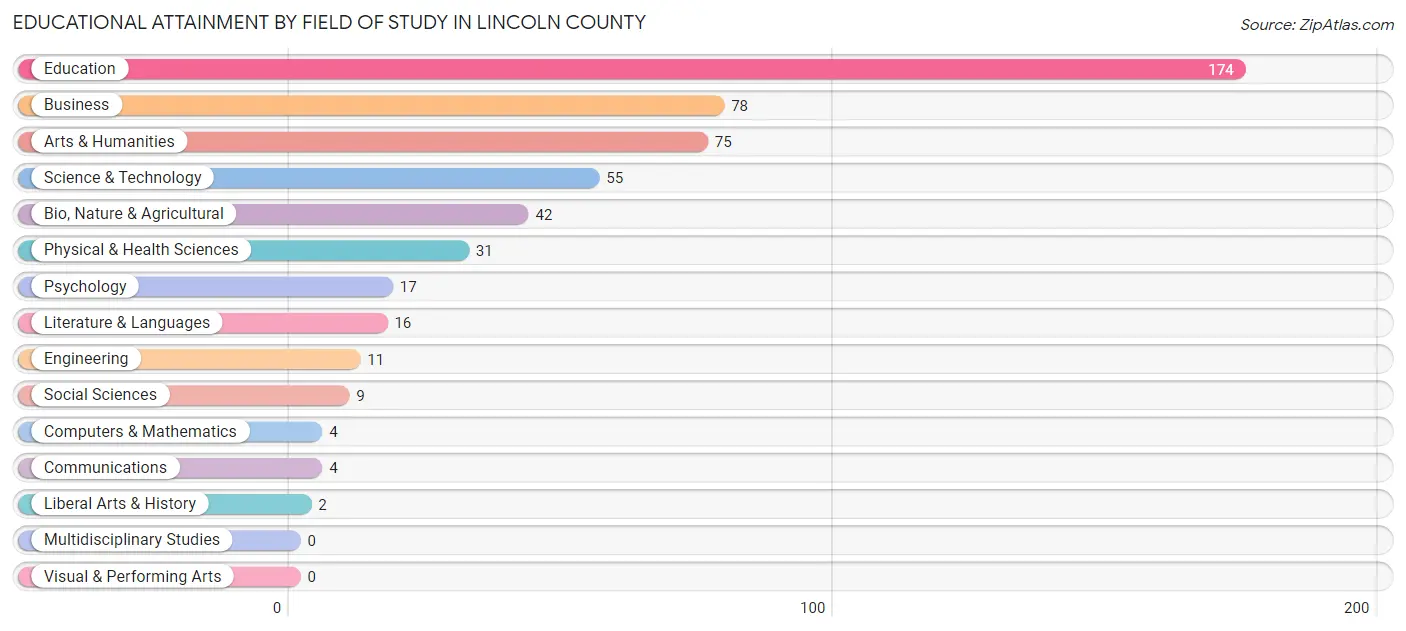
Educational Attainment by Field of Study in Lincoln County
Education (174 | 33.6%), business (78 | 15.1%), arts & humanities (75 | 14.5%), science & technology (55 | 10.6%), and bio, nature & agricultural (42 | 8.1%) are the most common fields of study among 518 individuals in Lincoln County who have obtained a bachelor's degree or higher.
| Field of Study | # Graduates | % Graduates |
| Computers & Mathematics | 4 | 0.8% |
| Bio, Nature & Agricultural | 42 | 8.1% |
| Physical & Health Sciences | 31 | 6.0% |
| Psychology | 17 | 3.3% |
| Social Sciences | 9 | 1.7% |
| Engineering | 11 | 2.1% |
| Multidisciplinary Studies | 0 | 0.0% |
| Science & Technology | 55 | 10.6% |
| Business | 78 | 15.1% |
| Education | 174 | 33.6% |
| Literature & Languages | 16 | 3.1% |
| Liberal Arts & History | 2 | 0.4% |
| Visual & Performing Arts | 0 | 0.0% |
| Communications | 4 | 0.8% |
| Arts & Humanities | 75 | 14.5% |
| Total | 518 | 100.0% |
Transportation & Commute in Lincoln County
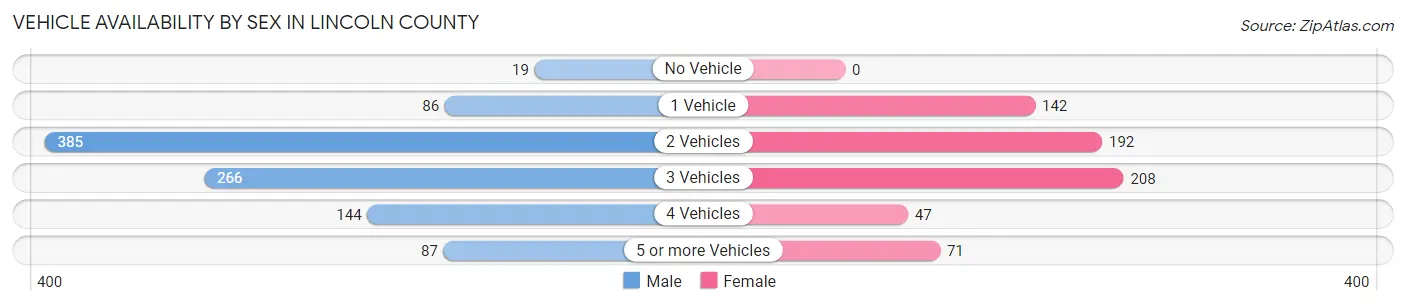
Vehicle Availability by Sex in Lincoln County
The most prevalent vehicle ownership categories in Lincoln County are males with 2 vehicles (385, accounting for 39.0%) and females with 2 vehicles (192, making up 58.3%).
| Vehicles Available | Male | Female |
| No Vehicle | 19 (1.9%) | 0 (0.0%) |
| 1 Vehicle | 86 (8.7%) | 142 (21.5%) |
| 2 Vehicles | 385 (39.0%) | 192 (29.1%) |
| 3 Vehicles | 266 (27.0%) | 208 (31.5%) |
| 4 Vehicles | 144 (14.6%) | 47 (7.1%) |
| 5 or more Vehicles | 87 (8.8%) | 71 (10.8%) |
| Total | 987 (100.0%) | 660 (100.0%) |
Commute Time in Lincoln County
The most frequently occuring commute durations in Lincoln County are less than 5 minutes (534 commuters, 36.8%), 10 to 14 minutes (225 commuters, 15.5%), and 15 to 19 minutes (155 commuters, 10.7%).
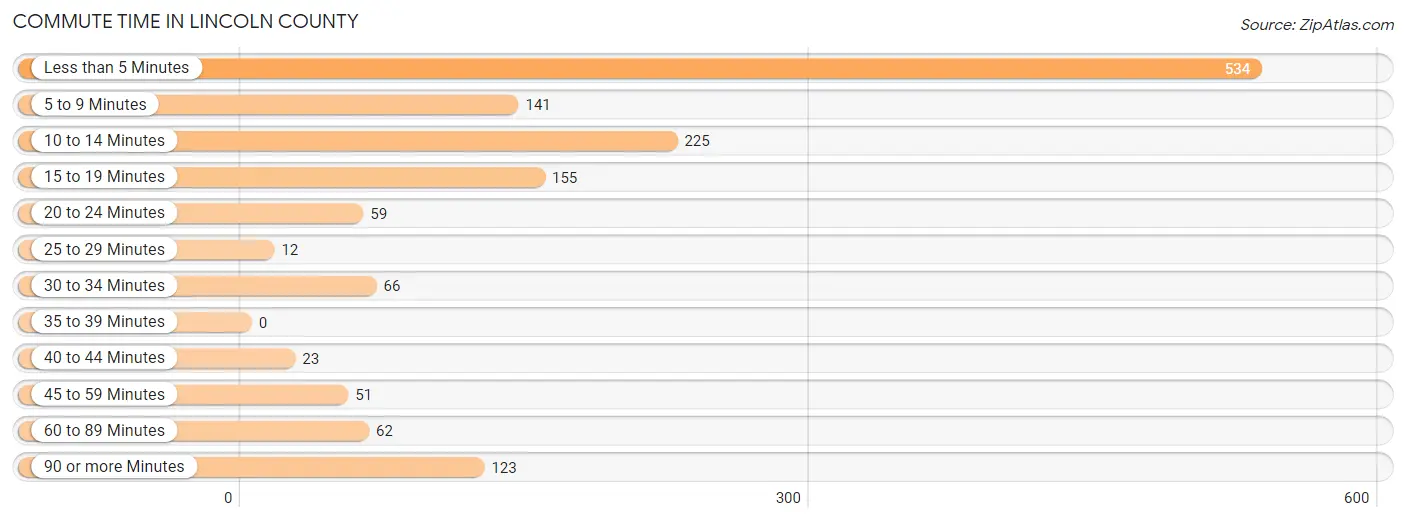
| Commute Time | # Commuters | % Commuters |
| Less than 5 Minutes | 534 | 36.8% |
| 5 to 9 Minutes | 141 | 9.7% |
| 10 to 14 Minutes | 225 | 15.5% |
| 15 to 19 Minutes | 155 | 10.7% |
| 20 to 24 Minutes | 59 | 4.1% |
| 25 to 29 Minutes | 12 | 0.8% |
| 30 to 34 Minutes | 66 | 4.5% |
| 35 to 39 Minutes | 0 | 0.0% |
| 40 to 44 Minutes | 23 | 1.6% |
| 45 to 59 Minutes | 51 | 3.5% |
| 60 to 89 Minutes | 62 | 4.3% |
| 90 or more Minutes | 123 | 8.5% |
Commute Time by Sex in Lincoln County
The most common commute times in Lincoln County are less than 5 minutes (343 commuters, 37.2%) for males and less than 5 minutes (191 commuters, 36.1%) for females.
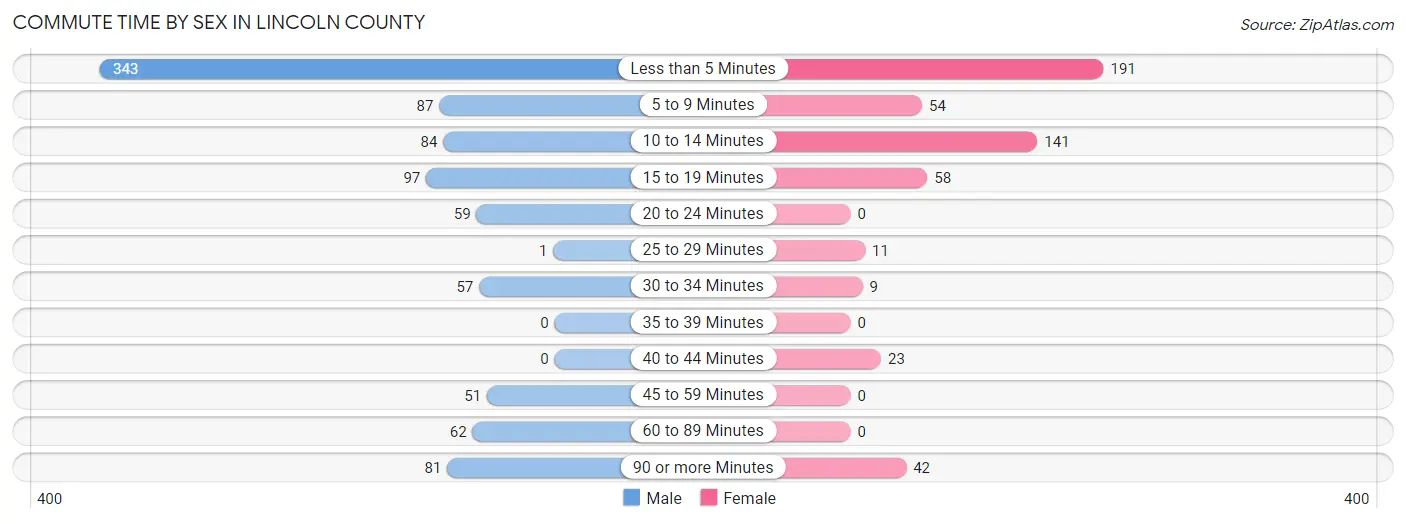
| Commute Time | Male | Female |
| Less than 5 Minutes | 343 (37.2%) | 191 (36.1%) |
| 5 to 9 Minutes | 87 (9.4%) | 54 (10.2%) |
| 10 to 14 Minutes | 84 (9.1%) | 141 (26.7%) |
| 15 to 19 Minutes | 97 (10.5%) | 58 (11.0%) |
| 20 to 24 Minutes | 59 (6.4%) | 0 (0.0%) |
| 25 to 29 Minutes | 1 (0.1%) | 11 (2.1%) |
| 30 to 34 Minutes | 57 (6.2%) | 9 (1.7%) |
| 35 to 39 Minutes | 0 (0.0%) | 0 (0.0%) |
| 40 to 44 Minutes | 0 (0.0%) | 23 (4.3%) |
| 45 to 59 Minutes | 51 (5.5%) | 0 (0.0%) |
| 60 to 89 Minutes | 62 (6.7%) | 0 (0.0%) |
| 90 or more Minutes | 81 (8.8%) | 42 (7.9%) |
Time of Departure to Work by Sex in Lincoln County
The most frequent times of departure to work in Lincoln County are 7:00 AM to 7:29 AM (186, 20.2%) for males and 7:00 AM to 7:29 AM (169, 32.0%) for females.
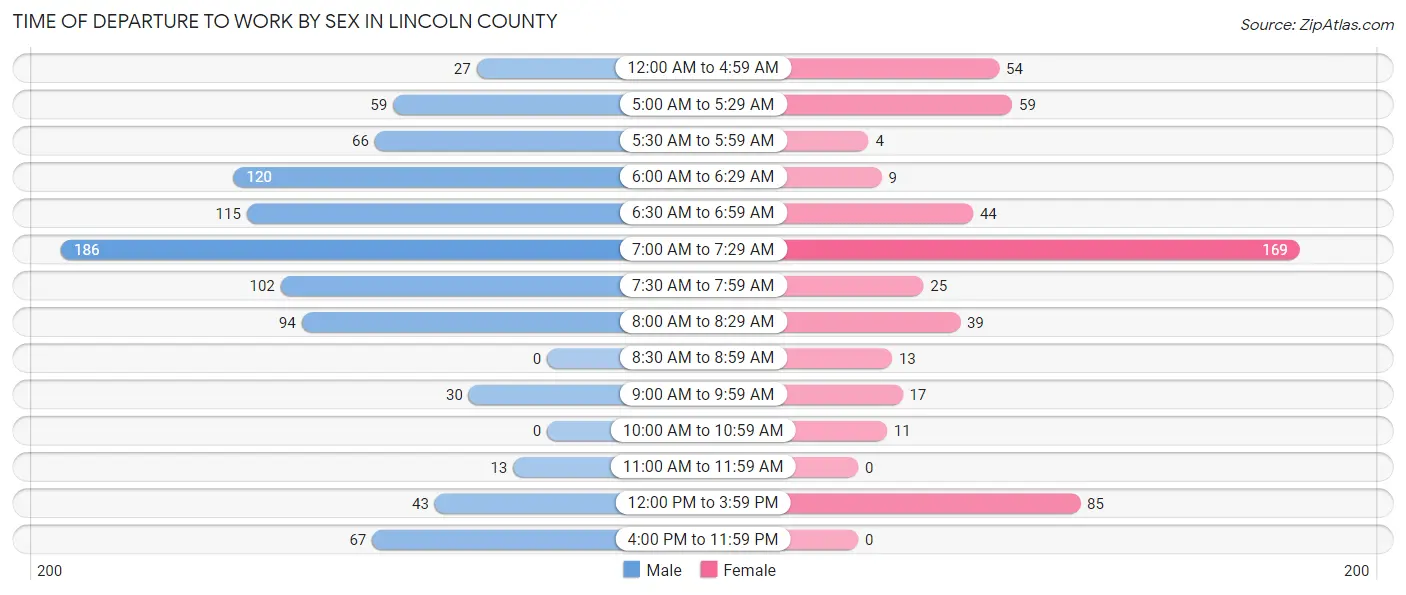
| Time of Departure | Male | Female |
| 12:00 AM to 4:59 AM | 27 (2.9%) | 54 (10.2%) |
| 5:00 AM to 5:29 AM | 59 (6.4%) | 59 (11.2%) |
| 5:30 AM to 5:59 AM | 66 (7.2%) | 4 (0.8%) |
| 6:00 AM to 6:29 AM | 120 (13.0%) | 9 (1.7%) |
| 6:30 AM to 6:59 AM | 115 (12.5%) | 44 (8.3%) |
| 7:00 AM to 7:29 AM | 186 (20.2%) | 169 (32.0%) |
| 7:30 AM to 7:59 AM | 102 (11.1%) | 25 (4.7%) |
| 8:00 AM to 8:29 AM | 94 (10.2%) | 39 (7.4%) |
| 8:30 AM to 8:59 AM | 0 (0.0%) | 13 (2.5%) |
| 9:00 AM to 9:59 AM | 30 (3.3%) | 17 (3.2%) |
| 10:00 AM to 10:59 AM | 0 (0.0%) | 11 (2.1%) |
| 11:00 AM to 11:59 AM | 13 (1.4%) | 0 (0.0%) |
| 12:00 PM to 3:59 PM | 43 (4.7%) | 85 (16.1%) |
| 4:00 PM to 11:59 PM | 67 (7.3%) | 0 (0.0%) |
| Total | 922 (100.0%) | 529 (100.0%) |
Housing Occupancy in Lincoln County
Occupancy by Ownership in Lincoln County
Of the total 1,645 dwellings in Lincoln County, owner-occupied units account for 1,212 (73.7%), while renter-occupied units make up 433 (26.3%).
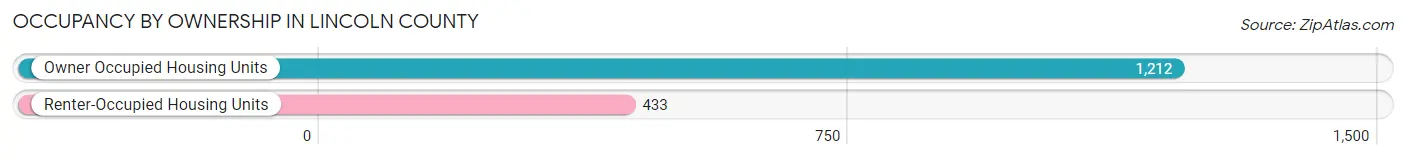
| Occupancy | # Housing Units | % Housing Units |
| Owner Occupied Housing Units | 1,212 | 73.7% |
| Renter-Occupied Housing Units | 433 | 26.3% |
| Total Occupied Housing Units | 1,645 | 100.0% |
Occupancy by Household Size in Lincoln County
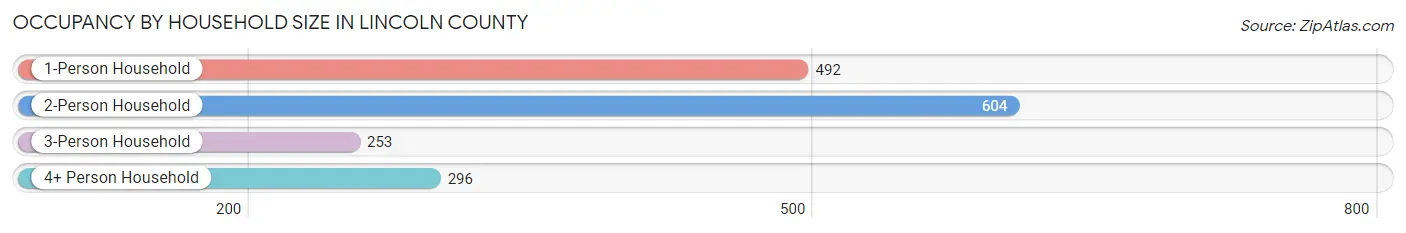
| Household Size | # Housing Units | % Housing Units |
| 1-Person Household | 492 | 29.9% |
| 2-Person Household | 604 | 36.7% |
| 3-Person Household | 253 | 15.4% |
| 4+ Person Household | 296 | 18.0% |
| Total Housing Units | 1,645 | 100.0% |
Occupancy by Ownership by Household Size in Lincoln County
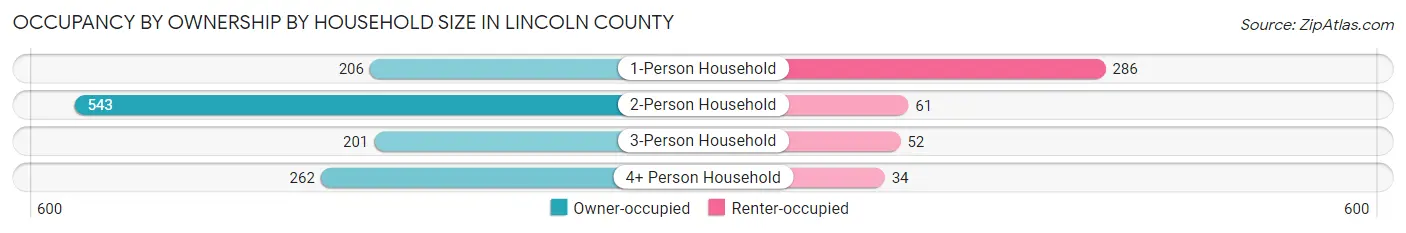
| Household Size | Owner-occupied | Renter-occupied |
| 1-Person Household | 206 (41.9%) | 286 (58.1%) |
| 2-Person Household | 543 (89.9%) | 61 (10.1%) |
| 3-Person Household | 201 (79.4%) | 52 (20.5%) |
| 4+ Person Household | 262 (88.5%) | 34 (11.5%) |
| Total Housing Units | 1,212 (73.7%) | 433 (26.3%) |
Occupancy by Educational Attainment in Lincoln County
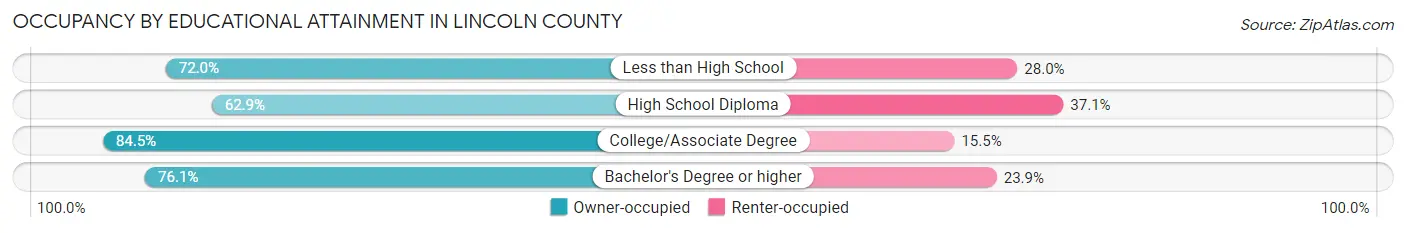
| Household Size | Owner-occupied | Renter-occupied |
| Less than High School | 90 (72.0%) | 35 (28.0%) |
| High School Diploma | 393 (62.9%) | 232 (37.1%) |
| College/Associate Degree | 484 (84.5%) | 89 (15.5%) |
| Bachelor's Degree or higher | 245 (76.1%) | 77 (23.9%) |
Occupancy by Age of Householder in Lincoln County
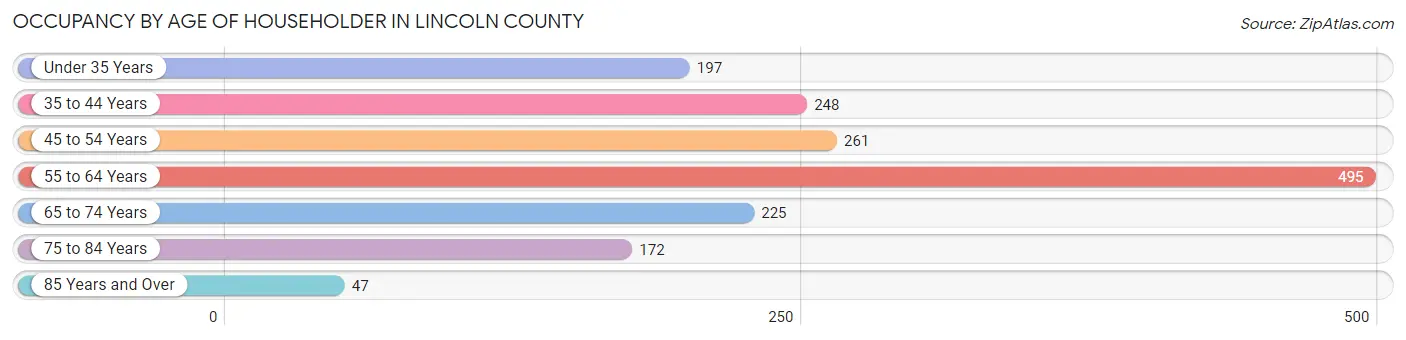
| Age Bracket | # Households | % Households |
| Under 35 Years | 197 | 12.0% |
| 35 to 44 Years | 248 | 15.1% |
| 45 to 54 Years | 261 | 15.9% |
| 55 to 64 Years | 495 | 30.1% |
| 65 to 74 Years | 225 | 13.7% |
| 75 to 84 Years | 172 | 10.5% |
| 85 Years and Over | 47 | 2.9% |
| Total | 1,645 | 100.0% |
Housing Finances in Lincoln County
Median Income by Occupancy in Lincoln County
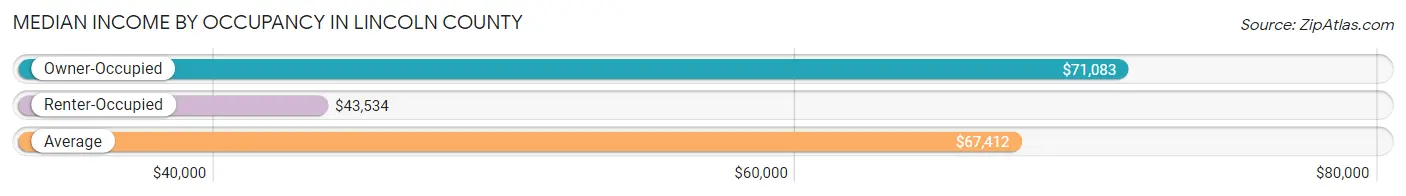
| Occupancy Type | # Households | Median Income |
| Owner-Occupied | 1,212 (73.7%) | $71,083 |
| Renter-Occupied | 433 (26.3%) | $43,534 |
| Average | 1,645 (100.0%) | $67,412 |
Occupancy by Householder Income Bracket in Lincoln County
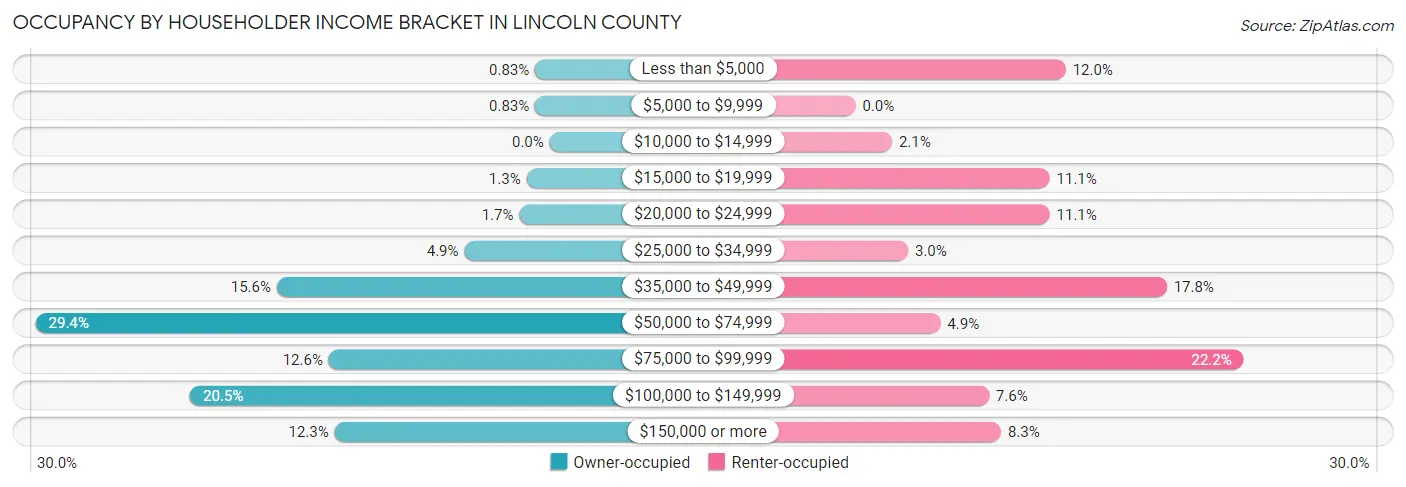
| Income Bracket | Owner-occupied | Renter-occupied |
| Less than $5,000 | 10 (0.8%) | 52 (12.0%) |
| $5,000 to $9,999 | 10 (0.8%) | 0 (0.0%) |
| $10,000 to $14,999 | 0 (0.0%) | 9 (2.1%) |
| $15,000 to $19,999 | 16 (1.3%) | 48 (11.1%) |
| $20,000 to $24,999 | 21 (1.7%) | 48 (11.1%) |
| $25,000 to $34,999 | 59 (4.9%) | 13 (3.0%) |
| $35,000 to $49,999 | 189 (15.6%) | 77 (17.8%) |
| $50,000 to $74,999 | 356 (29.4%) | 21 (4.9%) |
| $75,000 to $99,999 | 153 (12.6%) | 96 (22.2%) |
| $100,000 to $149,999 | 249 (20.5%) | 33 (7.6%) |
| $150,000 or more | 149 (12.3%) | 36 (8.3%) |
| Total | 1,212 (100.0%) | 433 (100.0%) |
Monthly Housing Cost Tiers in Lincoln County
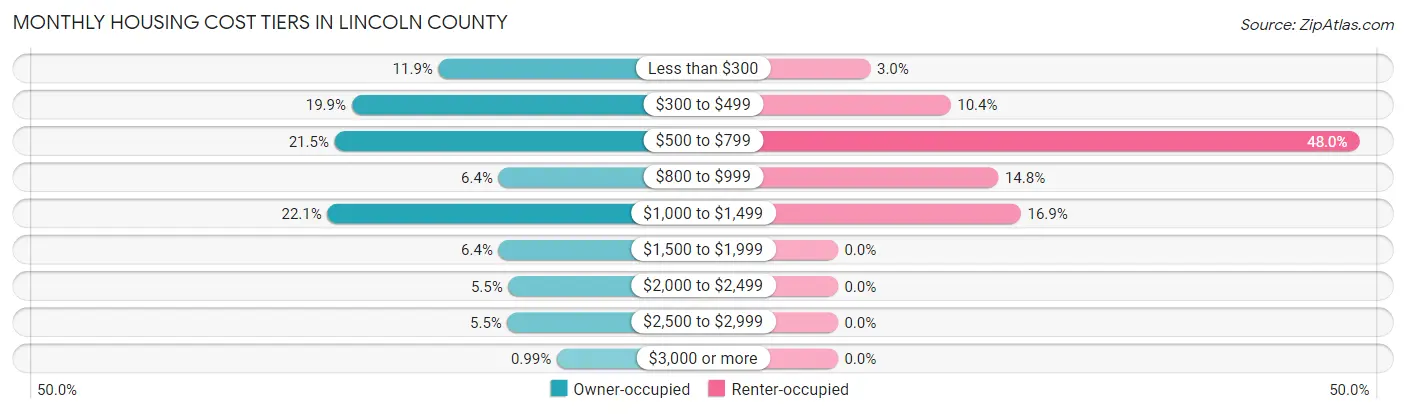
| Monthly Cost | Owner-occupied | Renter-occupied |
| Less than $300 | 144 (11.9%) | 13 (3.0%) |
| $300 to $499 | 241 (19.9%) | 45 (10.4%) |
| $500 to $799 | 260 (21.4%) | 208 (48.0%) |
| $800 to $999 | 77 (6.4%) | 64 (14.8%) |
| $1,000 to $1,499 | 268 (22.1%) | 73 (16.9%) |
| $1,500 to $1,999 | 77 (6.4%) | 0 (0.0%) |
| $2,000 to $2,499 | 66 (5.4%) | 0 (0.0%) |
| $2,500 to $2,999 | 67 (5.5%) | 0 (0.0%) |
| $3,000 or more | 12 (1.0%) | 0 (0.0%) |
| Total | 1,212 (100.0%) | 433 (100.0%) |
Physical Housing Characteristics in Lincoln County
Housing Structures in Lincoln County
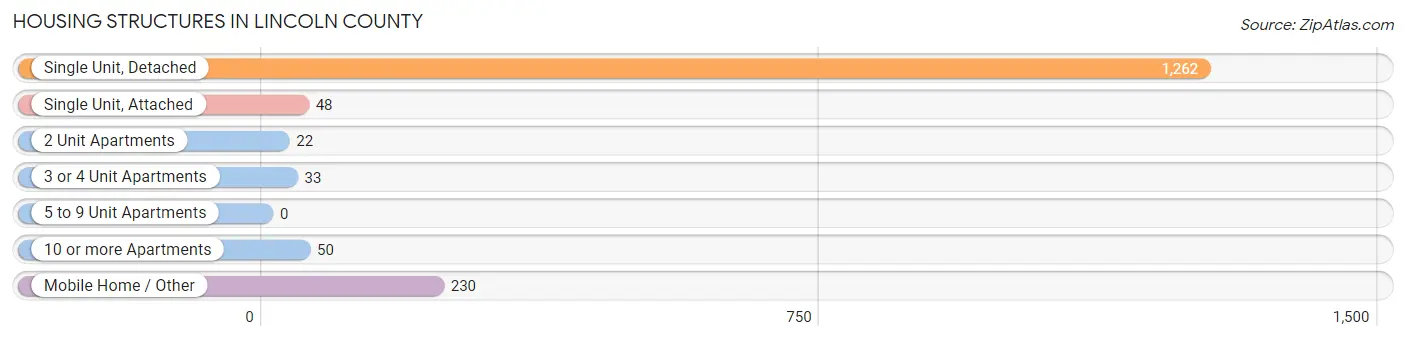
| Structure Type | # Housing Units | % Housing Units |
| Single Unit, Detached | 1,262 | 76.7% |
| Single Unit, Attached | 48 | 2.9% |
| 2 Unit Apartments | 22 | 1.3% |
| 3 or 4 Unit Apartments | 33 | 2.0% |
| 5 to 9 Unit Apartments | 0 | 0.0% |
| 10 or more Apartments | 50 | 3.0% |
| Mobile Home / Other | 230 | 14.0% |
| Total | 1,645 | 100.0% |
Housing Structures by Occupancy in Lincoln County
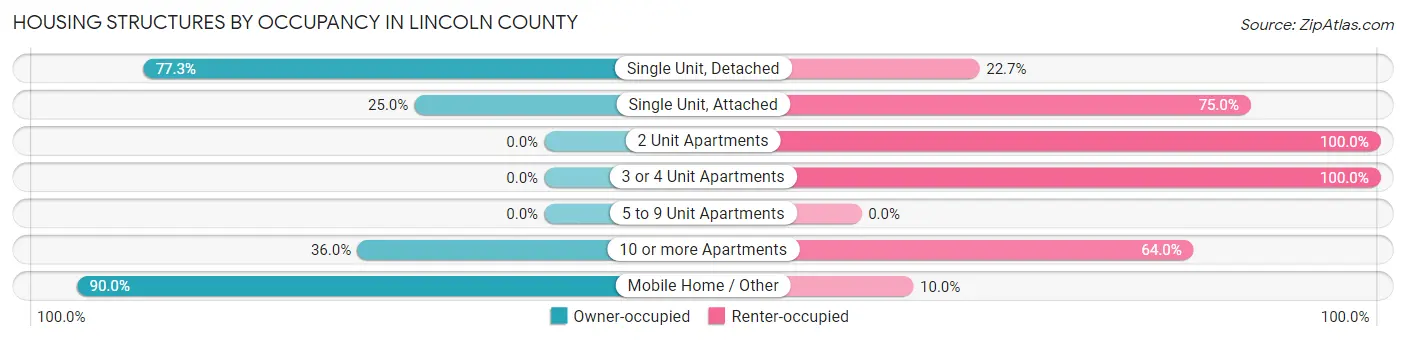
| Structure Type | Owner-occupied | Renter-occupied |
| Single Unit, Detached | 975 (77.3%) | 287 (22.7%) |
| Single Unit, Attached | 12 (25.0%) | 36 (75.0%) |
| 2 Unit Apartments | 0 (0.0%) | 22 (100.0%) |
| 3 or 4 Unit Apartments | 0 (0.0%) | 33 (100.0%) |
| 5 to 9 Unit Apartments | 0 (0.0%) | 0 (0.0%) |
| 10 or more Apartments | 18 (36.0%) | 32 (64.0%) |
| Mobile Home / Other | 207 (90.0%) | 23 (10.0%) |
| Total | 1,212 (73.7%) | 433 (26.3%) |
Housing Structures by Number of Rooms in Lincoln County
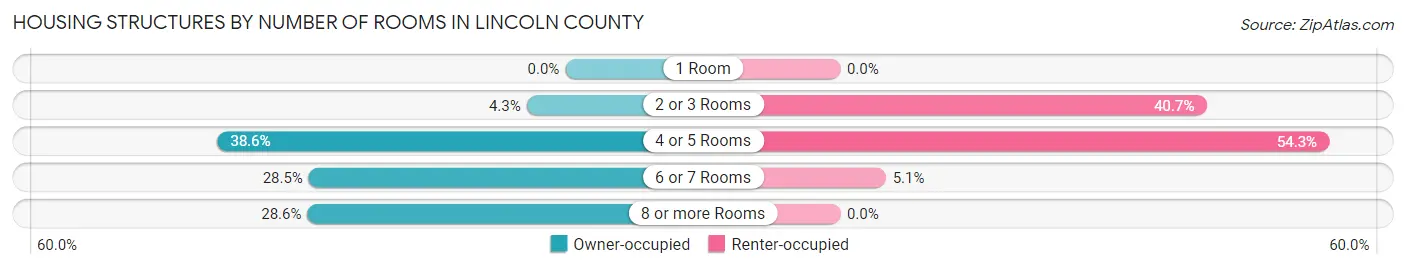
| Number of Rooms | Owner-occupied | Renter-occupied |
| 1 Room | 0 (0.0%) | 0 (0.0%) |
| 2 or 3 Rooms | 52 (4.3%) | 176 (40.6%) |
| 4 or 5 Rooms | 468 (38.6%) | 235 (54.3%) |
| 6 or 7 Rooms | 345 (28.5%) | 22 (5.1%) |
| 8 or more Rooms | 347 (28.6%) | 0 (0.0%) |
| Total | 1,212 (100.0%) | 433 (100.0%) |
Housing Structure by Heating Type in Lincoln County
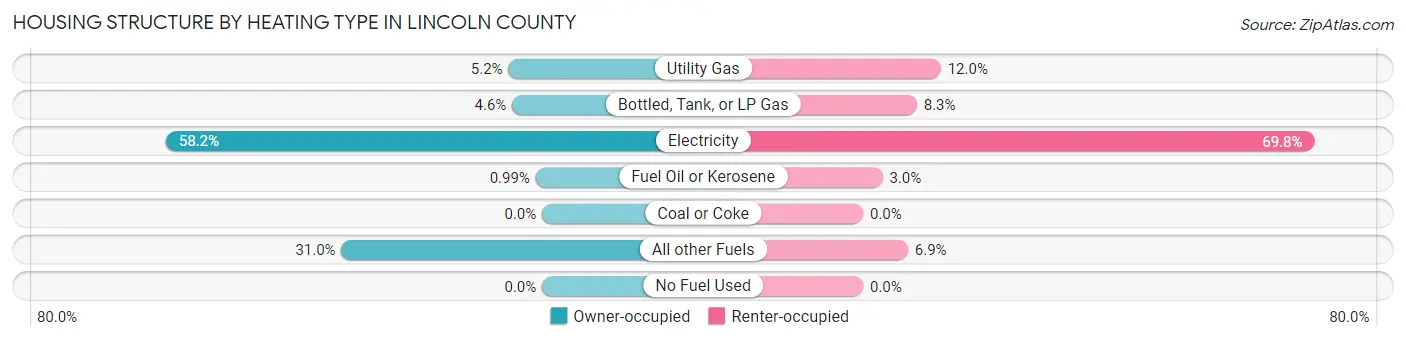
| Heating Type | Owner-occupied | Renter-occupied |
| Utility Gas | 63 (5.2%) | 52 (12.0%) |
| Bottled, Tank, or LP Gas | 56 (4.6%) | 36 (8.3%) |
| Electricity | 705 (58.2%) | 302 (69.8%) |
| Fuel Oil or Kerosene | 12 (1.0%) | 13 (3.0%) |
| Coal or Coke | 0 (0.0%) | 0 (0.0%) |
| All other Fuels | 376 (31.0%) | 30 (6.9%) |
| No Fuel Used | 0 (0.0%) | 0 (0.0%) |
| Total | 1,212 (100.0%) | 433 (100.0%) |
Household Vehicle Usage in Lincoln County
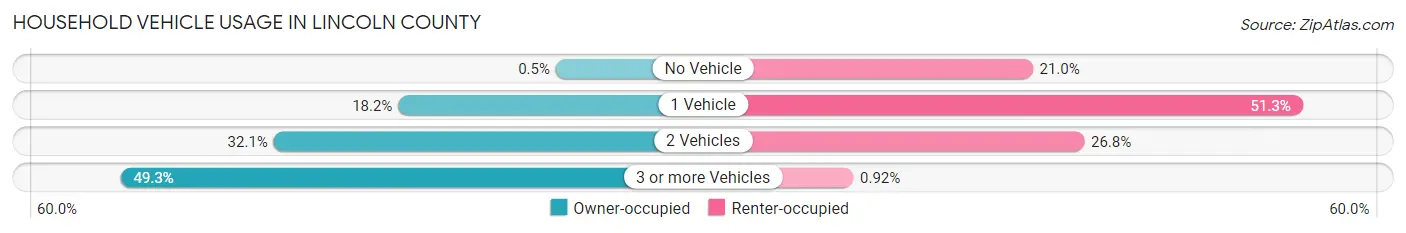
| Vehicles per Household | Owner-occupied | Renter-occupied |
| No Vehicle | 6 (0.5%) | 91 (21.0%) |
| 1 Vehicle | 220 (18.1%) | 222 (51.3%) |
| 2 Vehicles | 389 (32.1%) | 116 (26.8%) |
| 3 or more Vehicles | 597 (49.3%) | 4 (0.9%) |
| Total | 1,212 (100.0%) | 433 (100.0%) |
Real Estate & Mortgages in Lincoln County
Real Estate and Mortgage Overview in Lincoln County
| Characteristic | Without Mortgage | With Mortgage |
| Housing Units | 560 | 652 |
| Median Property Value | $147,800 | $205,900 |
| Median Household Income | $65,298 | $111 |
| Monthly Housing Costs | $435 | $12 |
| Real Estate Taxes | $889 | $51 |
Property Value by Mortgage Status in Lincoln County
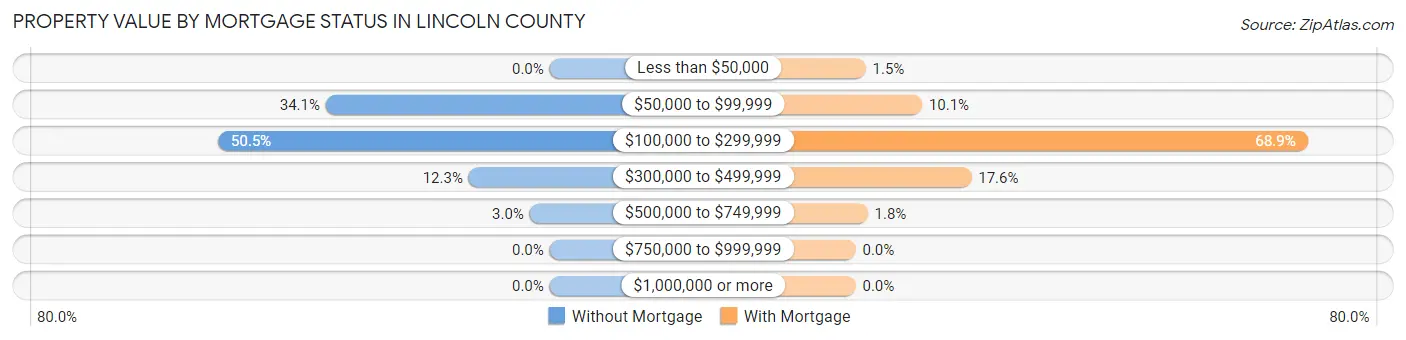
| Property Value | Without Mortgage | With Mortgage |
| Less than $50,000 | 0 (0.0%) | 10 (1.5%) |
| $50,000 to $99,999 | 191 (34.1%) | 66 (10.1%) |
| $100,000 to $299,999 | 283 (50.5%) | 449 (68.9%) |
| $300,000 to $499,999 | 69 (12.3%) | 115 (17.6%) |
| $500,000 to $749,999 | 17 (3.0%) | 12 (1.8%) |
| $750,000 to $999,999 | 0 (0.0%) | 0 (0.0%) |
| $1,000,000 or more | 0 (0.0%) | 0 (0.0%) |
| Total | 560 (100.0%) | 652 (100.0%) |
Household Income by Mortgage Status in Lincoln County
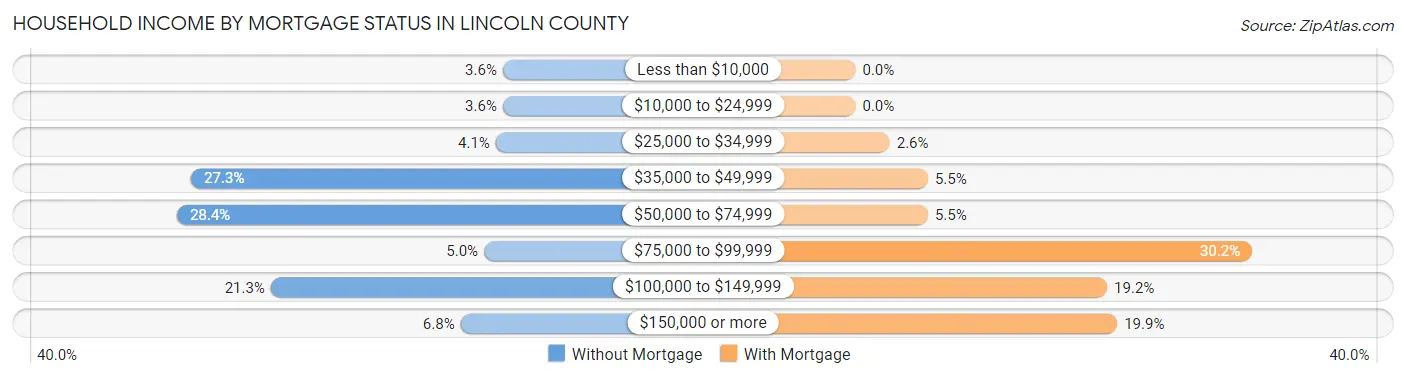
| Household Income | Without Mortgage | With Mortgage |
| Less than $10,000 | 20 (3.6%) | 0 (0.0%) |
| $10,000 to $24,999 | 20 (3.6%) | 0 (0.0%) |
| $25,000 to $34,999 | 23 (4.1%) | 17 (2.6%) |
| $35,000 to $49,999 | 153 (27.3%) | 36 (5.5%) |
| $50,000 to $74,999 | 159 (28.4%) | 36 (5.5%) |
| $75,000 to $99,999 | 28 (5.0%) | 197 (30.2%) |
| $100,000 to $149,999 | 119 (21.2%) | 125 (19.2%) |
| $150,000 or more | 38 (6.8%) | 130 (19.9%) |
| Total | 560 (100.0%) | 652 (100.0%) |
Property Value to Household Income Ratio in Lincoln County
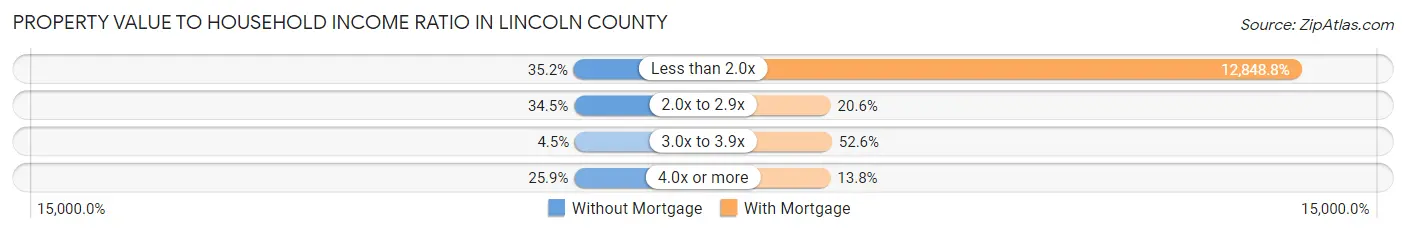
| Value-to-Income Ratio | Without Mortgage | With Mortgage |
| Less than 2.0x | 197 (35.2%) | 83,774 (12,848.8%) |
| 2.0x to 2.9x | 193 (34.5%) | 134 (20.5%) |
| 3.0x to 3.9x | 25 (4.5%) | 343 (52.6%) |
| 4.0x or more | 145 (25.9%) | 90 (13.8%) |
| Total | 560 (100.0%) | 652 (100.0%) |
Real Estate Taxes by Mortgage Status in Lincoln County
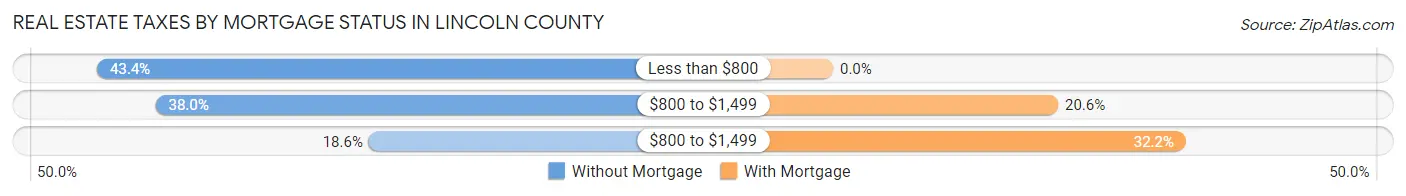
| Property Taxes | Without Mortgage | With Mortgage |
| Less than $800 | 243 (43.4%) | 0 (0.0%) |
| $800 to $1,499 | 213 (38.0%) | 134 (20.5%) |
| $800 to $1,499 | 104 (18.6%) | 210 (32.2%) |
| Total | 560 (100.0%) | 652 (100.0%) |
Health & Disability in Lincoln County
Health Insurance Coverage by Age in Lincoln County
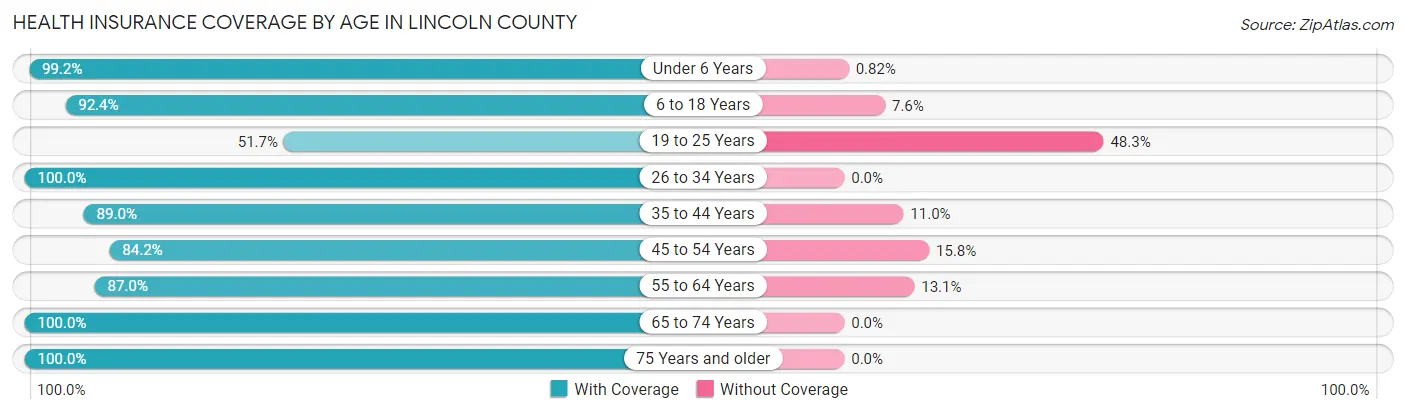
| Age Bracket | With Coverage | Without Coverage |
| Under 6 Years | 242 (99.2%) | 2 (0.8%) |
| 6 to 18 Years | 681 (92.4%) | 56 (7.6%) |
| 19 to 25 Years | 139 (51.7%) | 130 (48.3%) |
| 26 to 34 Years | 317 (100.0%) | 0 (0.0%) |
| 35 to 44 Years | 428 (89.0%) | 53 (11.0%) |
| 45 to 54 Years | 500 (84.2%) | 94 (15.8%) |
| 55 to 64 Years | 573 (87.0%) | 86 (13.1%) |
| 65 to 74 Years | 378 (100.0%) | 0 (0.0%) |
| 75 Years and older | 332 (100.0%) | 0 (0.0%) |
| Total | 3,590 (89.5%) | 421 (10.5%) |
Health Insurance Coverage by Citizenship Status in Lincoln County
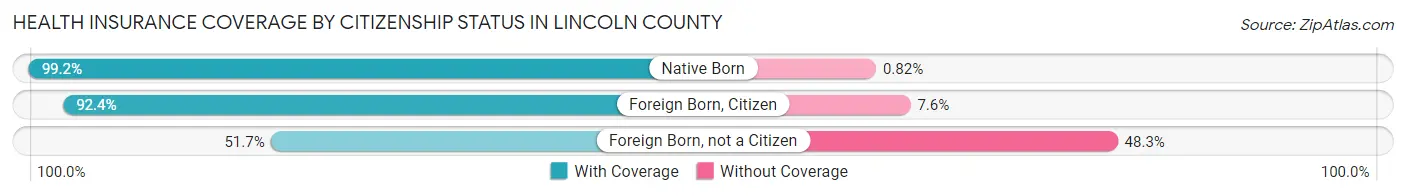
| Citizenship Status | With Coverage | Without Coverage |
| Native Born | 242 (99.2%) | 2 (0.8%) |
| Foreign Born, Citizen | 681 (92.4%) | 56 (7.6%) |
| Foreign Born, not a Citizen | 139 (51.7%) | 130 (48.3%) |
Health Insurance Coverage by Household Income in Lincoln County
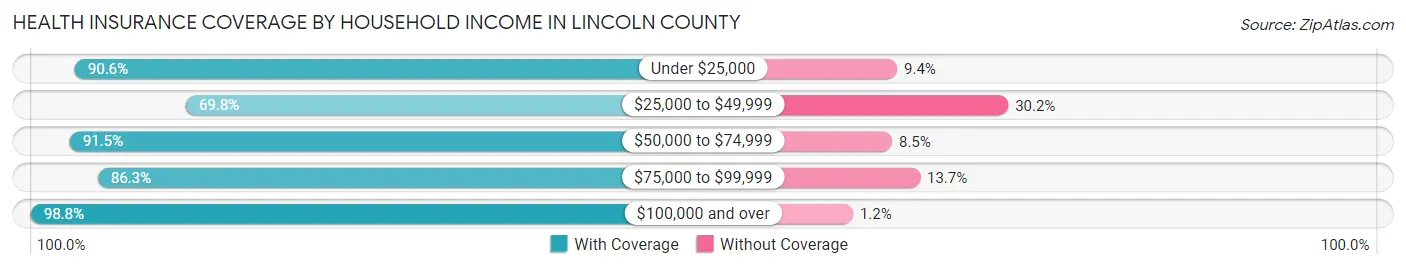
| Household Income | With Coverage | Without Coverage |
| Under $25,000 | 279 (90.6%) | 29 (9.4%) |
| $25,000 to $49,999 | 519 (69.8%) | 225 (30.2%) |
| $50,000 to $74,999 | 820 (91.5%) | 76 (8.5%) |
| $75,000 to $99,999 | 434 (86.3%) | 69 (13.7%) |
| $100,000 and over | 1,534 (98.8%) | 18 (1.2%) |
Public vs Private Health Insurance Coverage by Age in Lincoln County
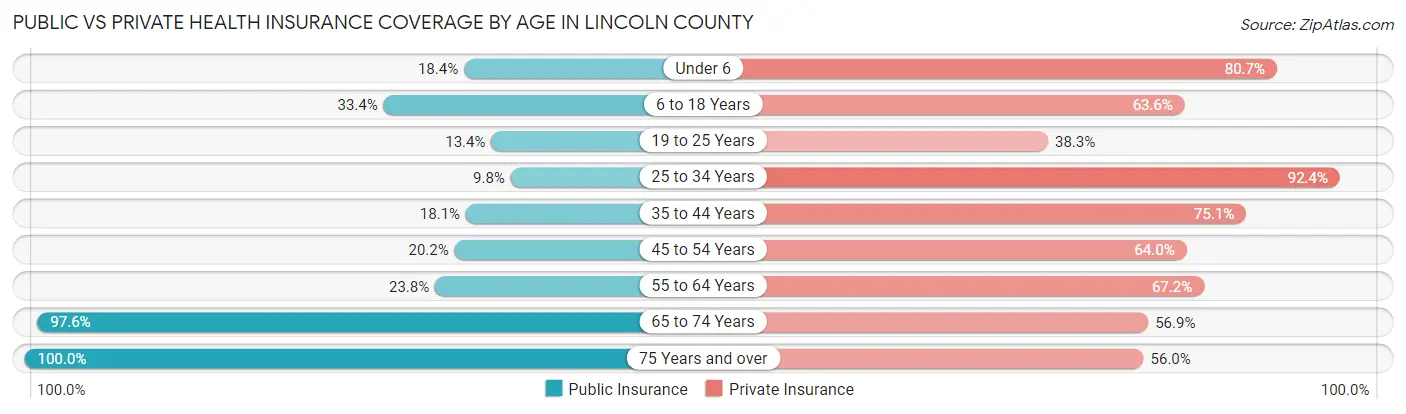
| Age Bracket | Public Insurance | Private Insurance |
| Under 6 | 45 (18.4%) | 197 (80.7%) |
| 6 to 18 Years | 246 (33.4%) | 469 (63.6%) |
| 19 to 25 Years | 36 (13.4%) | 103 (38.3%) |
| 25 to 34 Years | 31 (9.8%) | 293 (92.4%) |
| 35 to 44 Years | 87 (18.1%) | 361 (75.0%) |
| 45 to 54 Years | 120 (20.2%) | 380 (64.0%) |
| 55 to 64 Years | 157 (23.8%) | 443 (67.2%) |
| 65 to 74 Years | 369 (97.6%) | 215 (56.9%) |
| 75 Years and over | 332 (100.0%) | 186 (56.0%) |
| Total | 1,423 (35.5%) | 2,647 (66.0%) |
Disability Status by Sex by Age in Lincoln County
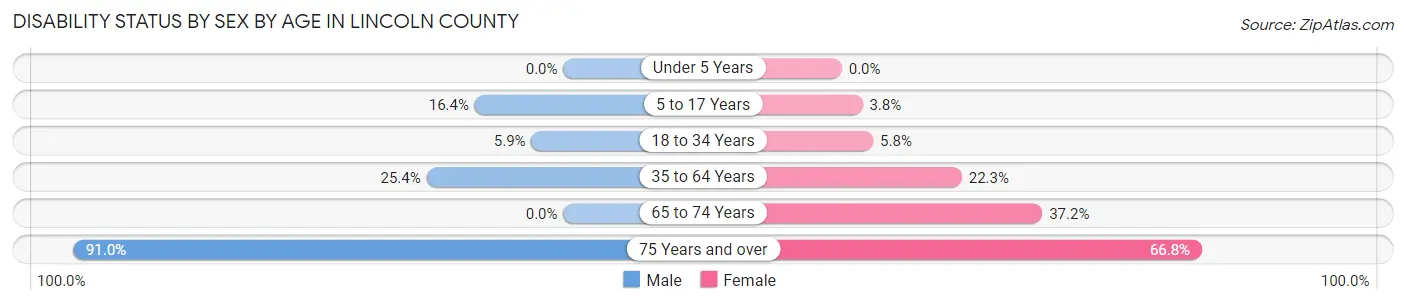
| Age Bracket | Male | Female |
| Under 5 Years | 0 (0.0%) | 0 (0.0%) |
| 5 to 17 Years | 70 (16.4%) | 13 (3.8%) |
| 18 to 34 Years | 14 (5.9%) | 22 (5.8%) |
| 35 to 64 Years | 242 (25.4%) | 174 (22.3%) |
| 65 to 74 Years | 0 (0.0%) | 61 (37.2%) |
| 75 Years and over | 132 (91.0%) | 125 (66.8%) |
Disability Class by Sex by Age in Lincoln County
Disability Class: Hearing Difficulty
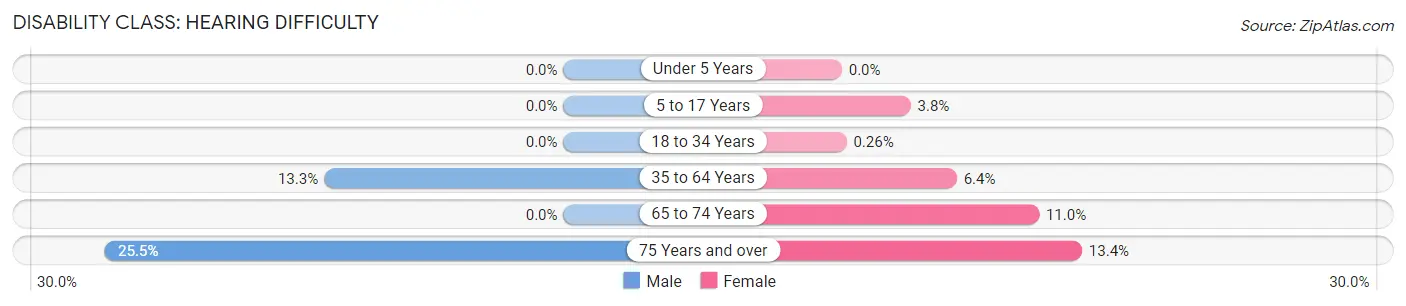
| Age Bracket | Male | Female |
| Under 5 Years | 0 (0.0%) | 0 (0.0%) |
| 5 to 17 Years | 0 (0.0%) | 13 (3.8%) |
| 18 to 34 Years | 0 (0.0%) | 1 (0.3%) |
| 35 to 64 Years | 127 (13.3%) | 50 (6.4%) |
| 65 to 74 Years | 0 (0.0%) | 18 (11.0%) |
| 75 Years and over | 37 (25.5%) | 25 (13.4%) |
Disability Class: Vision Difficulty
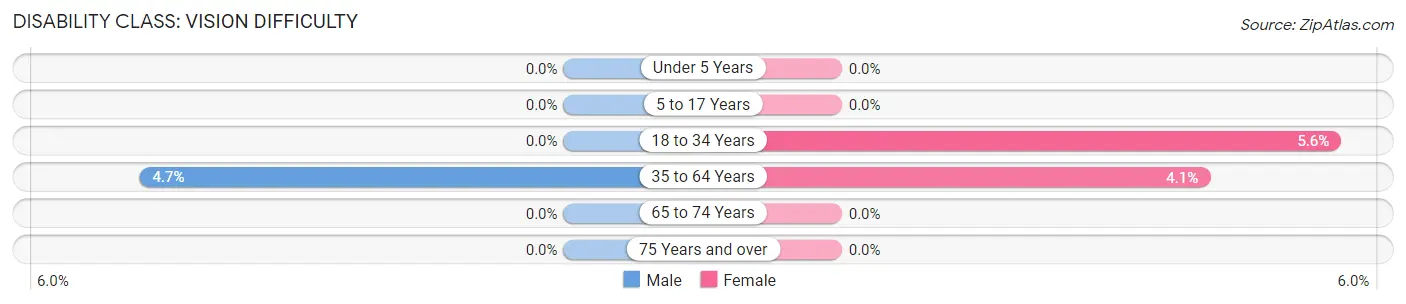
| Age Bracket | Male | Female |
| Under 5 Years | 0 (0.0%) | 0 (0.0%) |
| 5 to 17 Years | 0 (0.0%) | 0 (0.0%) |
| 18 to 34 Years | 0 (0.0%) | 21 (5.6%) |
| 35 to 64 Years | 45 (4.7%) | 32 (4.1%) |
| 65 to 74 Years | 0 (0.0%) | 0 (0.0%) |
| 75 Years and over | 0 (0.0%) | 0 (0.0%) |
Disability Class: Cognitive Difficulty
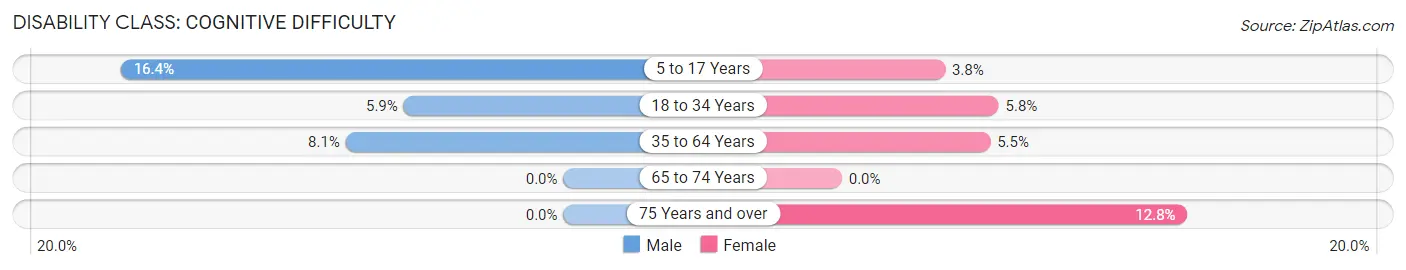
| Age Bracket | Male | Female |
| 5 to 17 Years | 70 (16.4%) | 13 (3.8%) |
| 18 to 34 Years | 14 (5.9%) | 22 (5.8%) |
| 35 to 64 Years | 77 (8.1%) | 43 (5.5%) |
| 65 to 74 Years | 0 (0.0%) | 0 (0.0%) |
| 75 Years and over | 0 (0.0%) | 24 (12.8%) |
Disability Class: Ambulatory Difficulty
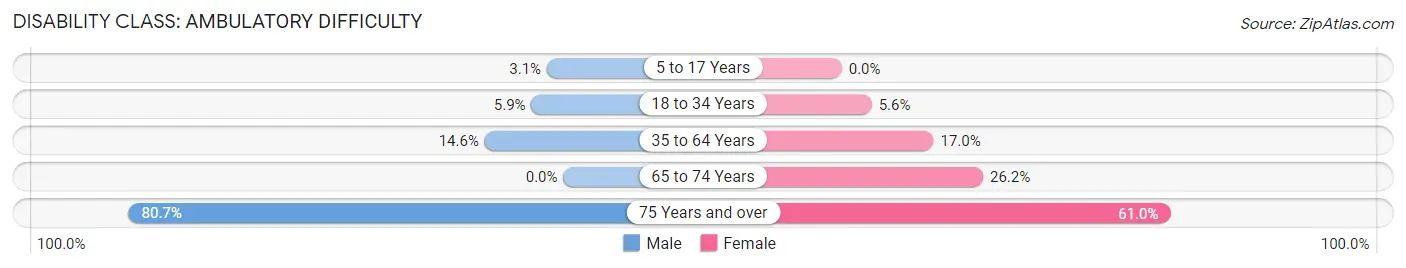
| Age Bracket | Male | Female |
| 5 to 17 Years | 13 (3.0%) | 0 (0.0%) |
| 18 to 34 Years | 14 (5.9%) | 21 (5.6%) |
| 35 to 64 Years | 139 (14.6%) | 133 (17.0%) |
| 65 to 74 Years | 0 (0.0%) | 43 (26.2%) |
| 75 Years and over | 117 (80.7%) | 114 (61.0%) |
Disability Class: Self-Care Difficulty
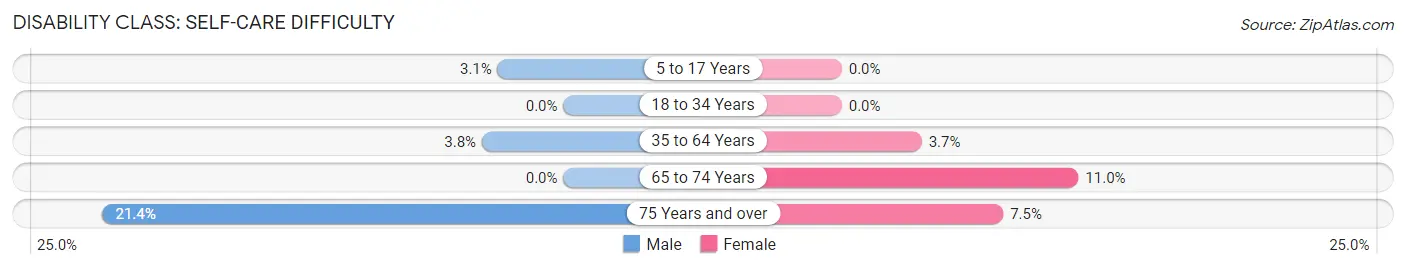
| Age Bracket | Male | Female |
| 5 to 17 Years | 13 (3.0%) | 0 (0.0%) |
| 18 to 34 Years | 0 (0.0%) | 0 (0.0%) |
| 35 to 64 Years | 36 (3.8%) | 29 (3.7%) |
| 65 to 74 Years | 0 (0.0%) | 18 (11.0%) |
| 75 Years and over | 31 (21.4%) | 14 (7.5%) |
Technology Access in Lincoln County
Computing Device Access in Lincoln County
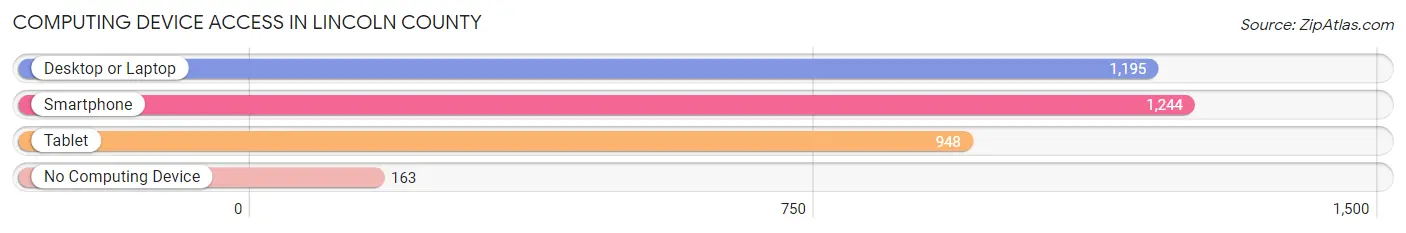
| Device Type | # Households | % Households |
| Desktop or Laptop | 1,195 | 72.6% |
| Smartphone | 1,244 | 75.6% |
| Tablet | 948 | 57.6% |
| No Computing Device | 163 | 9.9% |
| Total | 1,645 | 100.0% |
Internet Access in Lincoln County
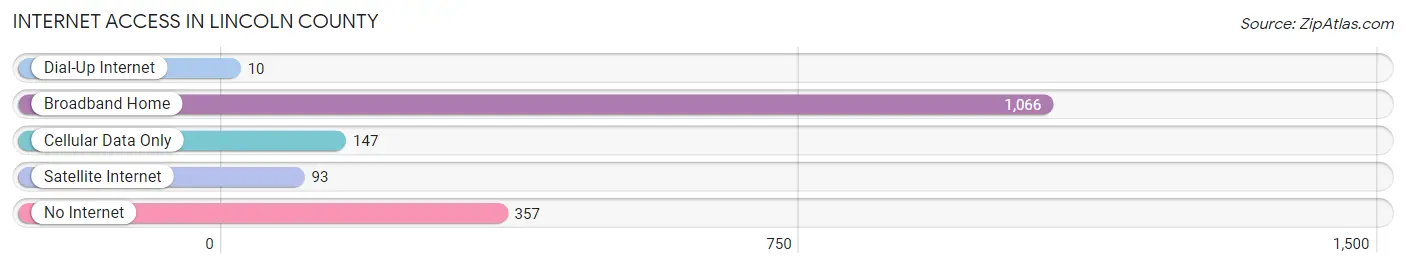
| Internet Type | # Households | % Households |
| Dial-Up Internet | 10 | 0.6% |
| Broadband Home | 1,066 | 64.8% |
| Cellular Data Only | 147 | 8.9% |
| Satellite Internet | 93 | 5.7% |
| No Internet | 357 | 21.7% |
| Total | 1,645 | 100.0% |
Lincoln County Summary
Lincoln County is located in the southeastern corner of Nevada, and is the seventh largest county in the state. It is bordered by Nye County to the north, White Pine County to the east, and Clark County to the south and west. The county seat is Pioche, and the largest city is Caliente. The county was named after President Abraham Lincoln, and was established in 1866.
Geography
Lincoln County covers an area of 7,814 square miles, making it the seventh largest county in Nevada. The county is located in the Great Basin region of the state, and is mostly made up of desert and mountain terrain. The highest point in the county is Mount Irish, which has an elevation of 9,717 feet. The county is home to several mountain ranges, including the Delamar Mountains, the White Pine Range, and the Schell Creek Range. The county also contains several large valleys, including the Meadow Valley Wash, the Pahranagat Valley, and the Delamar Valley.
The county is home to several large bodies of water, including Lake Valley Reservoir, Echo Reservoir, and the Pahranagat National Wildlife Refuge. The county also contains several hot springs, including the Delamar Hot Springs, the Meadow Valley Hot Springs, and the Pahranagat Hot Springs.
Economy
The economy of Lincoln County is largely based on mining, ranching, and tourism. The county is home to several large mining operations, including the Pioche Mine, the Delamar Mine, and the White Pine Mine. The county is also home to several large ranches, including the Delamar Ranch, the Meadow Valley Ranch, and the Pahranagat Ranch.
Tourism is also an important part of the county's economy. The county is home to several popular tourist attractions, including the Delamar Valley National Wildlife Refuge, the Meadow Valley Wash National Monument, and the Pahranagat National Wildlife Refuge. The county is also home to several popular outdoor recreation areas, including the Delamar Mountains Recreation Area, the White Pine Range Recreation Area, and the Schell Creek Range Recreation Area.
Demographics
As of the 2010 census, the population of Lincoln County was 5,345. The population density was 0.7 people per square mile. The racial makeup of the county was 91.3% White, 0.7% African American, 0.7% Native American, 0.3% Asian, 0.1% Pacific Islander, 4.7% from other races, and 2.1% from two or more races. Hispanic or Latino of any race were 8.3% of the population.
The median income for a household in the county was $41,944, and the median income for a family was $48,958. The per capita income for the county was $19,945. About 11.2% of families and 14.2% of the population were below the poverty line, including 17.2% of those under age 18 and 8.2% of those age 65 or over.
Conclusion
Lincoln County is a large county located in the southeastern corner of Nevada. The county is home to several large mining operations, ranches, and tourist attractions. The county's economy is largely based on mining, ranching, and tourism. The population of the county is 5,345, and the median income for a household is $41,944. Lincoln County is a diverse and vibrant county with a rich history and culture.
Common Questions
What is Per Capita Income in Lincoln County?
Per Capita income in Lincoln County is $32,459.
What is the Median Family Income in Lincoln County?
Median Family Income in Lincoln County is $85,950.
What is the Median Household income in Lincoln County?
Median Household Income in Lincoln County is $67,412.
What is Income or Wage Gap in Lincoln County?
Income or Wage Gap in Lincoln County is 35.6%.
Women in Lincoln County earn 64.4 cents for every dollar earned by a man.
What is Family Income Deficit in Lincoln County?
Family Income Deficit in Lincoln County is $14,991.
Families that are below poverty line in Lincoln County earn $14,991 less on average than the poverty threshold level.
What is Inequality or Gini Index in Lincoln County?
Inequality or Gini Index in Lincoln County is 0.38.
What is the Total Population of Lincoln County?
Total Population of Lincoln County is 4,507.
What is the Total Male Population of Lincoln County?
Total Male Population of Lincoln County is 2,516.
What is the Total Female Population of Lincoln County?
Total Female Population of Lincoln County is 1,991.
What is the Ratio of Males per 100 Females in Lincoln County?
There are 126.37 Males per 100 Females in Lincoln County.
What is the Ratio of Females per 100 Males in Lincoln County?
There are 79.13 Females per 100 Males in Lincoln County.
What is the Median Population Age in Lincoln County?
Median Population Age in Lincoln County is 40.6 Years.
What is the Average Family Size in Lincoln County
Average Family Size in Lincoln County is 3.1 People.
What is the Average Household Size in Lincoln County
Average Household Size in Lincoln County is 2.4 People.
How Large is the Labor Force in Lincoln County?
There are 1,720 People in the Labor Forcein in Lincoln County.
What is the Percentage of People in the Labor Force in Lincoln County?
47.0% of People are in the Labor Force in Lincoln County.
What is the Unemployment Rate in Lincoln County?
Unemployment Rate in Lincoln County is 4.1%.