Clark County, NV Map & Demographics
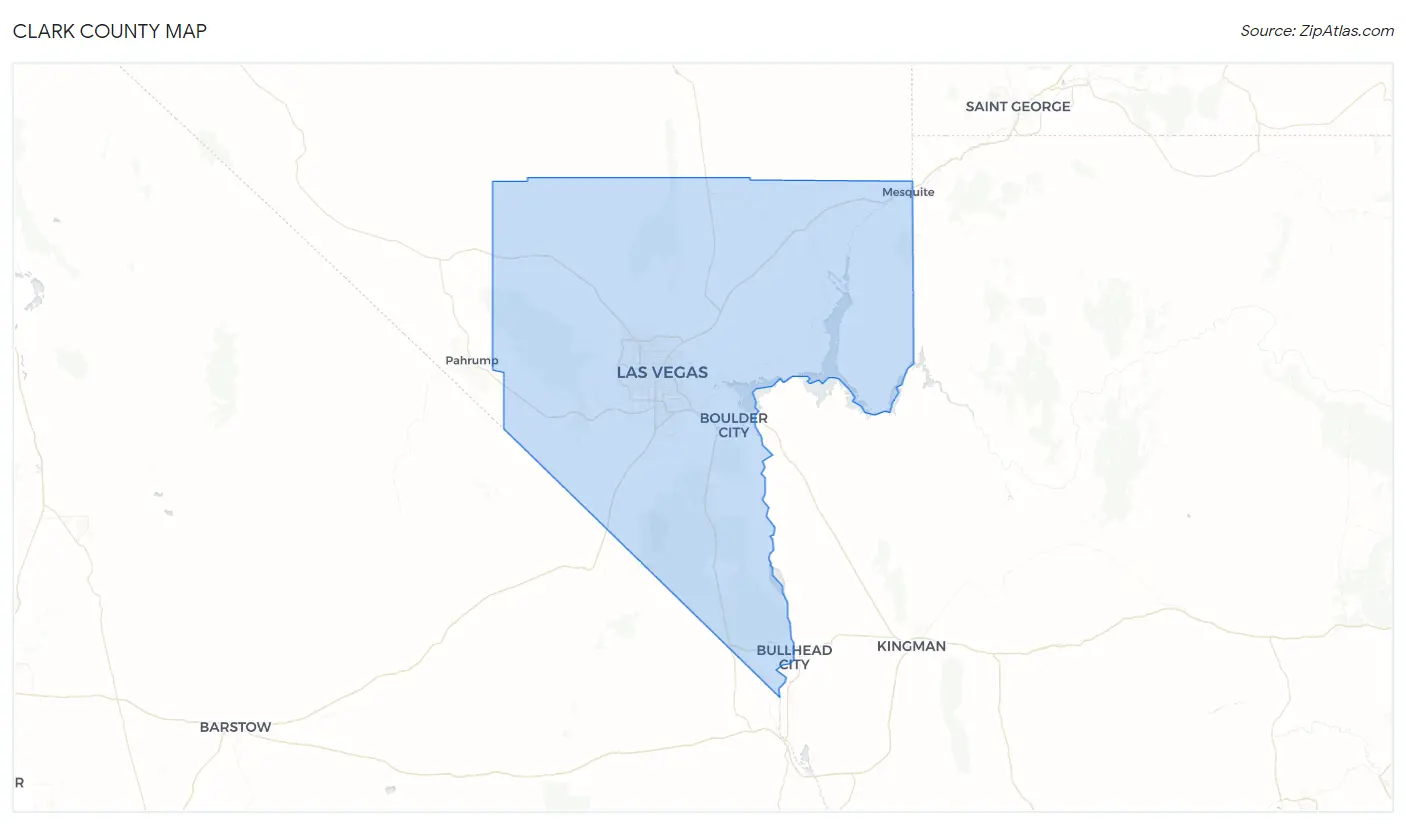
Clark County Map
Clark County Overview
$36,615
PER CAPITA INCOME
$82,358
AVG FAMILY INCOME
$69,911
AVG HOUSEHOLD INCOME
18.1%
WAGE / INCOME GAP [ % ]
81.9¢/ $1
WAGE / INCOME GAP [ $ ]
$11,534
FAMILY INCOME DEFICIT
0.47
INEQUALITY / GINI INDEX
2,265,926
TOTAL POPULATION
1,137,581
MALE POPULATION
1,128,345
FEMALE POPULATION
100.82
MALES / 100 FEMALES
99.19
FEMALES / 100 MALES
37.8
MEDIAN AGE
3.4
AVG FAMILY SIZE
2.7
AVG HOUSEHOLD SIZE
1,154,771
LABOR FORCE [ PEOPLE ]
63.8%
PERCENT IN LABOR FORCE
7.7%
UNEMPLOYMENT RATE
Income in Clark County
Income Overview in Clark County
Per Capita Income in Clark County is $36,615, while median incomes of families and households are $82,358 and $69,911 respectively.
| Characteristic | Number | Measure |
| Per Capita Income | 2,265,926 | $36,615 |
| Median Family Income | 532,434 | $82,358 |
| Mean Family Income | 532,434 | $109,040 |
| Median Household Income | 832,367 | $69,911 |
| Mean Household Income | 832,367 | $95,925 |
| Income Deficit | 532,434 | $11,534 |
| Wage / Income Gap (%) | 2,265,926 | 18.07% |
| Wage / Income Gap ($) | 2,265,926 | 81.93¢ per $1 |
| Gini / Inequality Index | 2,265,926 | 0.47 |
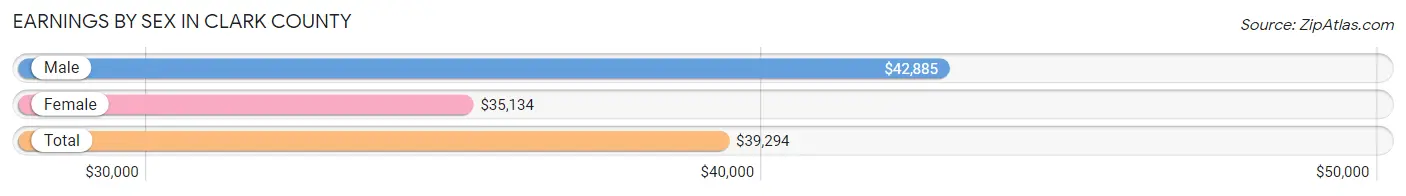
Earnings by Sex in Clark County
Average Earnings in Clark County are $39,294, $42,885 for men and $35,134 for women, a difference of 18.1%.
| Sex | Number | Average Earnings |
| Male | 631,925 (53.6%) | $42,885 |
| Female | 546,724 (46.4%) | $35,134 |
| Total | 1,178,649 (100.0%) | $39,294 |
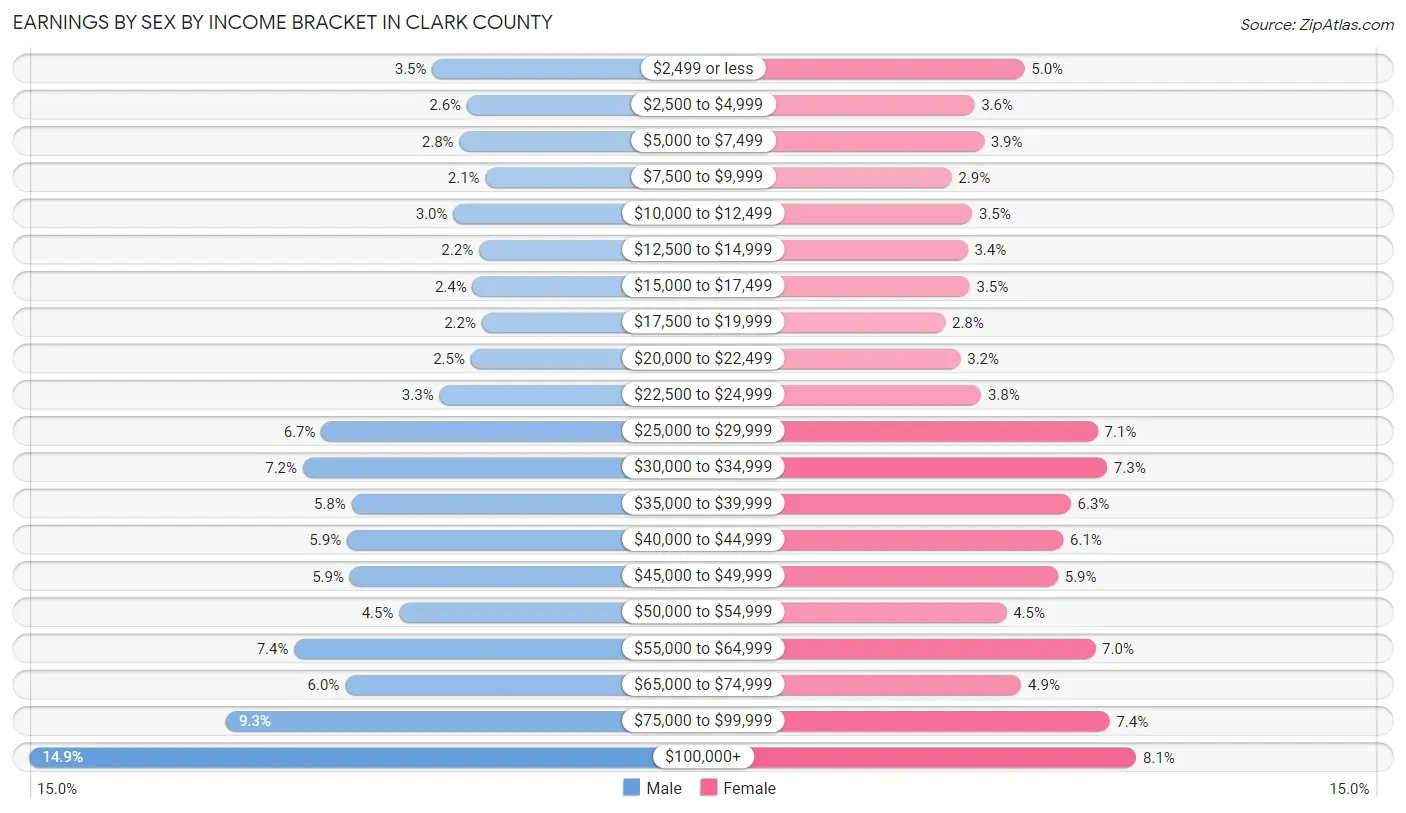
Earnings by Sex by Income Bracket in Clark County
The most common earnings brackets in Clark County are $100,000+ for men (93,922 | 14.9%) and $100,000+ for women (44,475 | 8.1%).
| Income | Male | Female |
| $2,499 or less | 22,347 (3.5%) | 27,305 (5.0%) |
| $2,500 to $4,999 | 16,252 (2.6%) | 19,581 (3.6%) |
| $5,000 to $7,499 | 17,583 (2.8%) | 21,043 (3.8%) |
| $7,500 to $9,999 | 12,927 (2.1%) | 16,099 (2.9%) |
| $10,000 to $12,499 | 18,615 (2.9%) | 19,253 (3.5%) |
| $12,500 to $14,999 | 14,101 (2.2%) | 18,548 (3.4%) |
| $15,000 to $17,499 | 15,259 (2.4%) | 18,858 (3.5%) |
| $17,500 to $19,999 | 13,610 (2.1%) | 15,083 (2.8%) |
| $20,000 to $22,499 | 15,537 (2.5%) | 17,449 (3.2%) |
| $22,500 to $24,999 | 21,093 (3.3%) | 20,606 (3.8%) |
| $25,000 to $29,999 | 42,106 (6.7%) | 38,553 (7.0%) |
| $30,000 to $34,999 | 45,396 (7.2%) | 39,960 (7.3%) |
| $35,000 to $39,999 | 36,708 (5.8%) | 34,378 (6.3%) |
| $40,000 to $44,999 | 37,511 (5.9%) | 33,268 (6.1%) |
| $45,000 to $49,999 | 37,016 (5.9%) | 32,448 (5.9%) |
| $50,000 to $54,999 | 28,246 (4.5%) | 24,511 (4.5%) |
| $55,000 to $64,999 | 46,859 (7.4%) | 38,173 (7.0%) |
| $65,000 to $74,999 | 37,828 (6.0%) | 26,772 (4.9%) |
| $75,000 to $99,999 | 59,009 (9.3%) | 40,361 (7.4%) |
| $100,000+ | 93,922 (14.9%) | 44,475 (8.1%) |
| Total | 631,925 (100.0%) | 546,724 (100.0%) |
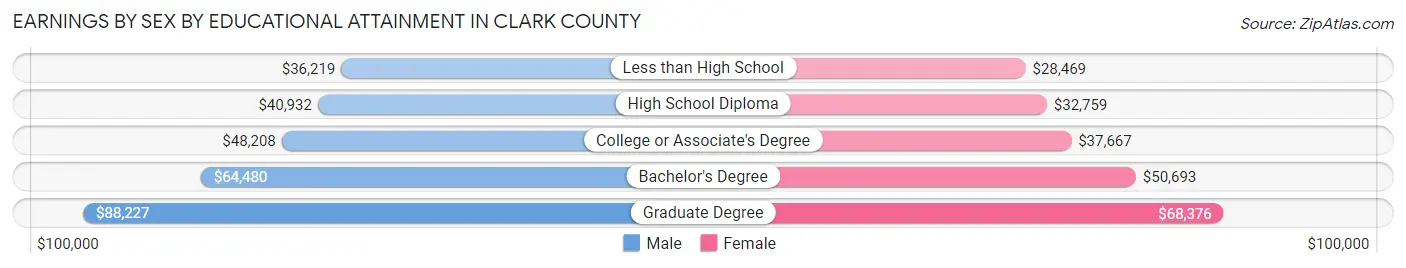
Earnings by Sex by Educational Attainment in Clark County
Average earnings in Clark County are $47,073 for men and $39,449 for women, a difference of 16.2%. Men with an educational attainment of graduate degree enjoy the highest average annual earnings of $88,227, while those with less than high school education earn the least with $36,219. Women with an educational attainment of graduate degree earn the most with the average annual earnings of $68,376, while those with less than high school education have the smallest earnings of $28,469.
| Educational Attainment | Male Income | Female Income |
| Less than High School | $36,219 | $28,469 |
| High School Diploma | $40,932 | $32,759 |
| College or Associate's Degree | $48,208 | $37,667 |
| Bachelor's Degree | $64,480 | $50,693 |
| Graduate Degree | $88,227 | $68,376 |
| Total | $47,073 | $39,449 |
Family Income in Clark County
Family Income Brackets in Clark County
According to the Clark County family income data, there are 103,825 families falling into the $100,000 to $149,999 income range, which is the most common income bracket and makes up 19.5% of all families. Conversely, the $10,000 to $14,999 income bracket is the least frequent group with only 9,584 families (1.8%) belonging to this category.
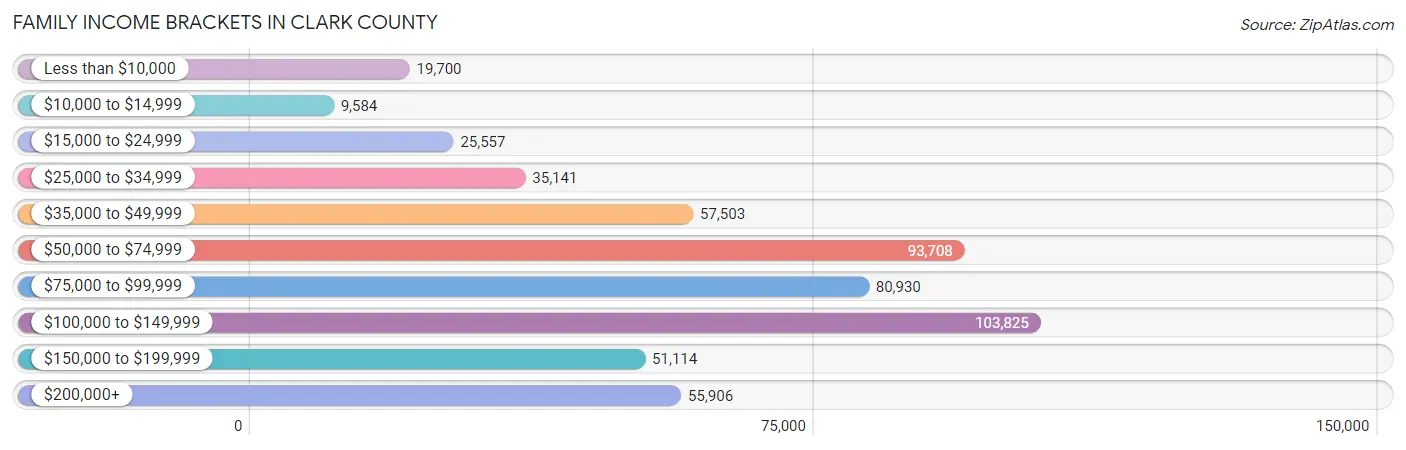
| Income Bracket | # Families | % Families |
| Less than $10,000 | 19,700 | 3.7% |
| $10,000 to $14,999 | 9,584 | 1.8% |
| $15,000 to $24,999 | 25,557 | 4.8% |
| $25,000 to $34,999 | 35,141 | 6.6% |
| $35,000 to $49,999 | 57,503 | 10.8% |
| $50,000 to $74,999 | 93,708 | 17.6% |
| $75,000 to $99,999 | 80,930 | 15.2% |
| $100,000 to $149,999 | 103,825 | 19.5% |
| $150,000 to $199,999 | 51,114 | 9.6% |
| $200,000+ | 55,906 | 10.5% |
Family Income by Famaliy Size in Clark County
7+ person families (12,955 | 2.4%) account for the highest median family income in Clark County with $104,278 per family, while 2-person families (238,620 | 44.8%) have the highest median income of $36,681 per family member.
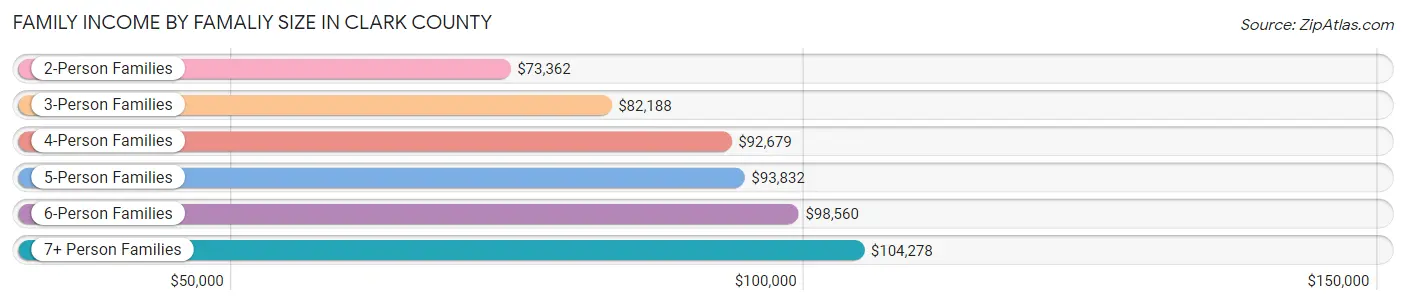
| Income Bracket | # Families | Median Income |
| 2-Person Families | 238,620 (44.8%) | $73,362 |
| 3-Person Families | 117,145 (22.0%) | $82,188 |
| 4-Person Families | 92,959 (17.5%) | $92,679 |
| 5-Person Families | 49,880 (9.4%) | $93,832 |
| 6-Person Families | 20,875 (3.9%) | $98,560 |
| 7+ Person Families | 12,955 (2.4%) | $104,278 |
| Total | 532,434 (100.0%) | $82,358 |
Family Income by Number of Earners in Clark County
The median family income in Clark County is $82,358, with families comprising 3+ earners (67,879) having the highest median family income of $129,527, while families with no earners (78,640) have the lowest median family income of $46,734, accounting for 12.8% and 14.8% of families, respectively.
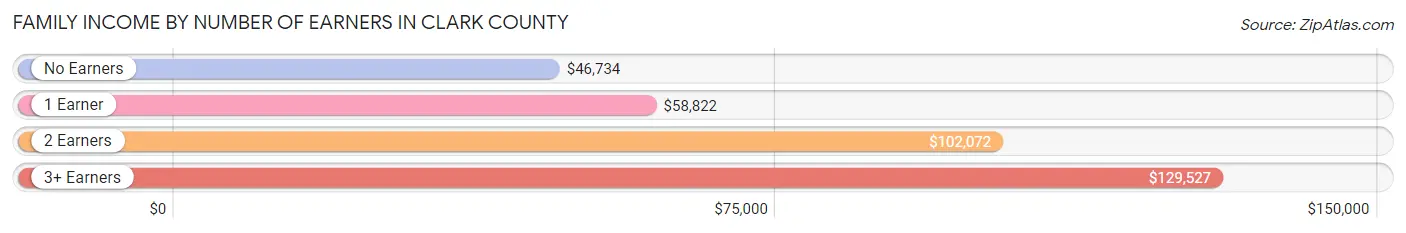
| Number of Earners | # Families | Median Income |
| No Earners | 78,640 (14.8%) | $46,734 |
| 1 Earner | 182,539 (34.3%) | $58,822 |
| 2 Earners | 203,376 (38.2%) | $102,072 |
| 3+ Earners | 67,879 (12.8%) | $129,527 |
| Total | 532,434 (100.0%) | $82,358 |
Household Income in Clark County
Household Income Brackets in Clark County
With 146,497 households falling in the category, the $50,000 to $74,999 income range is the most frequent in Clark County, accounting for 17.6% of all households. In contrast, only 25,803 households (3.1%) fall into the $10,000 to $14,999 income bracket, making it the least populous group.
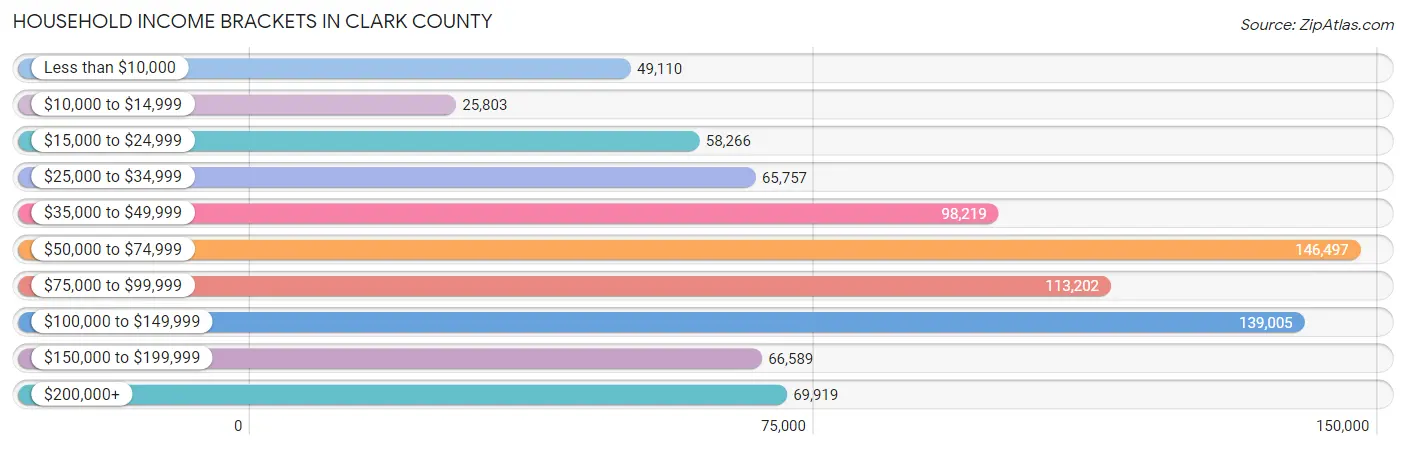
| Income Bracket | # Households | % Households |
| Less than $10,000 | 49,110 | 5.9% |
| $10,000 to $14,999 | 25,803 | 3.1% |
| $15,000 to $24,999 | 58,266 | 7.0% |
| $25,000 to $34,999 | 65,757 | 7.9% |
| $35,000 to $49,999 | 98,219 | 11.8% |
| $50,000 to $74,999 | 146,497 | 17.6% |
| $75,000 to $99,999 | 113,202 | 13.6% |
| $100,000 to $149,999 | 139,005 | 16.7% |
| $150,000 to $199,999 | 66,589 | 8.0% |
| $200,000+ | 69,919 | 8.4% |
Household Income by Householder Age in Clark County
The median household income in Clark County is $69,911, with the highest median household income of $81,332 found in the 45 to 64 years age bracket for the primary householder. A total of 306,565 households (36.8%) fall into this category. Meanwhile, the 15 to 24 years age bracket for the primary householder has the lowest median household income of $45,108, with 26,189 households (3.2%) in this group.
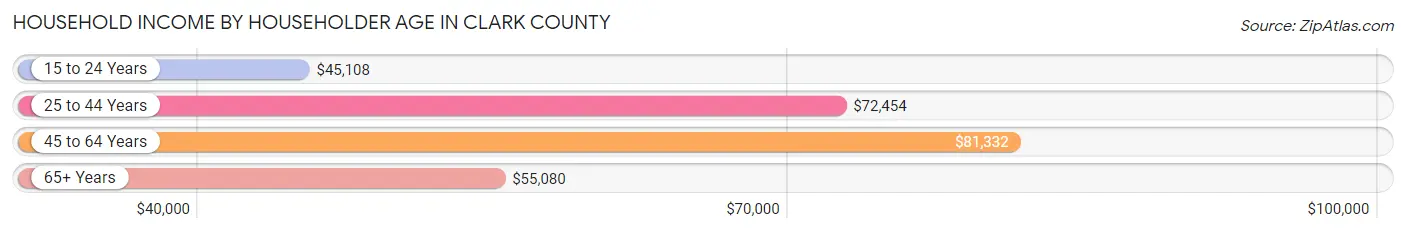
| Income Bracket | # Households | Median Income |
| 15 to 24 Years | 26,189 (3.2%) | $45,108 |
| 25 to 44 Years | 298,033 (35.8%) | $72,454 |
| 45 to 64 Years | 306,565 (36.8%) | $81,332 |
| 65+ Years | 201,580 (24.2%) | $55,080 |
| Total | 832,367 (100.0%) | $69,911 |
Poverty in Clark County
Income Below Poverty by Sex and Age in Clark County
With 12.0% poverty level for males and 14.7% for females among the residents of Clark County, under 5 year old males and 5 year old females are the most vulnerable to poverty, with 13,125 males (19.6%) and 2,932 females (21.9%) in their respective age groups living below the poverty level.
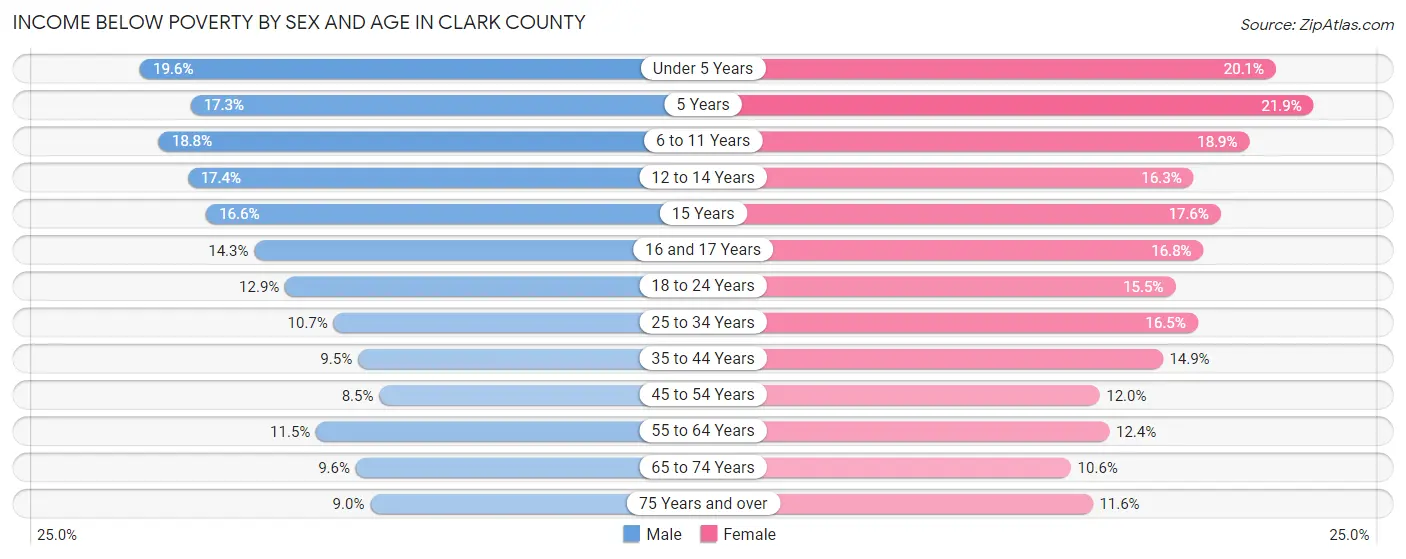
| Age Bracket | Male | Female |
| Under 5 Years | 13,125 (19.6%) | 12,904 (20.1%) |
| 5 Years | 2,450 (17.3%) | 2,932 (21.9%) |
| 6 to 11 Years | 16,410 (18.8%) | 15,708 (18.9%) |
| 12 to 14 Years | 8,072 (17.4%) | 7,202 (16.3%) |
| 15 Years | 2,341 (16.6%) | 2,705 (17.6%) |
| 16 and 17 Years | 4,403 (14.3%) | 4,671 (16.8%) |
| 18 to 24 Years | 12,358 (12.9%) | 14,207 (15.5%) |
| 25 to 34 Years | 17,632 (10.7%) | 26,957 (16.5%) |
| 35 to 44 Years | 15,140 (9.5%) | 23,086 (14.9%) |
| 45 to 54 Years | 12,773 (8.5%) | 17,352 (11.9%) |
| 55 to 64 Years | 15,375 (11.5%) | 16,661 (12.4%) |
| 65 to 74 Years | 9,561 (9.6%) | 11,650 (10.6%) |
| 75 Years and over | 5,356 (9.0%) | 8,428 (11.6%) |
| Total | 134,996 (12.0%) | 164,463 (14.7%) |
Income Above Poverty by Sex and Age in Clark County
According to the poverty statistics in Clark County, males aged 45 to 54 years and females aged 65 to 74 years are the age groups that are most secure financially, with 91.5% of males and 89.4% of females in these age groups living above the poverty line.
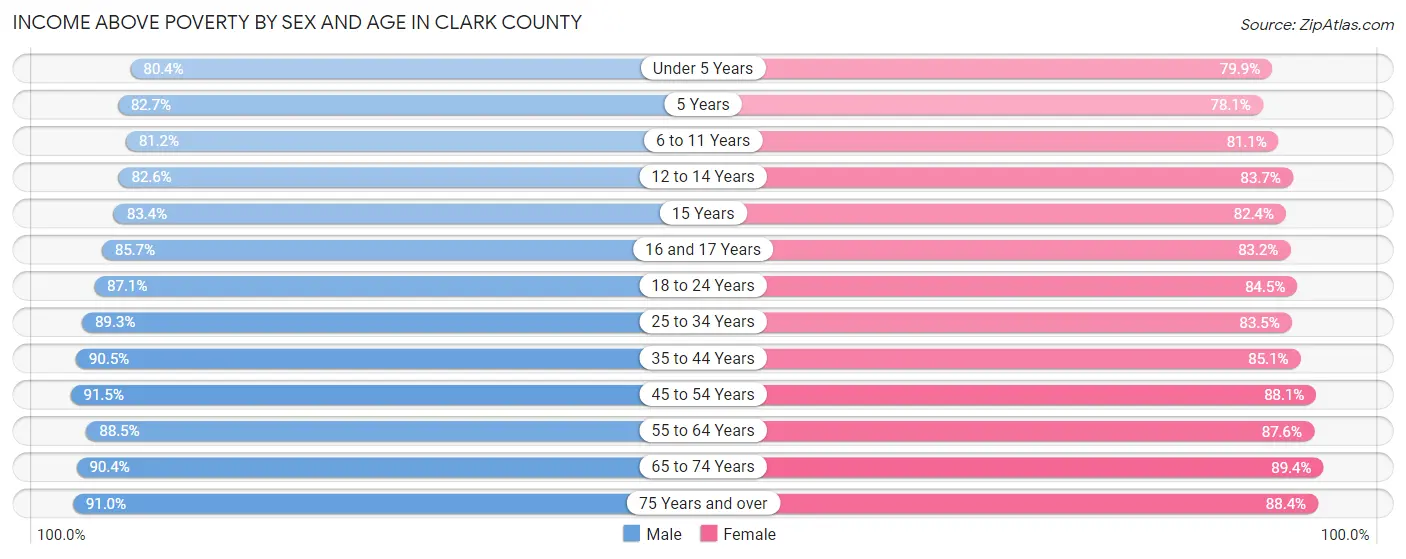
| Age Bracket | Male | Female |
| Under 5 Years | 53,692 (80.4%) | 51,158 (79.9%) |
| 5 Years | 11,721 (82.7%) | 10,465 (78.1%) |
| 6 to 11 Years | 71,015 (81.2%) | 67,351 (81.1%) |
| 12 to 14 Years | 38,250 (82.6%) | 36,936 (83.7%) |
| 15 Years | 11,785 (83.4%) | 12,686 (82.4%) |
| 16 and 17 Years | 26,300 (85.7%) | 23,164 (83.2%) |
| 18 to 24 Years | 83,400 (87.1%) | 77,624 (84.5%) |
| 25 to 34 Years | 147,784 (89.3%) | 136,327 (83.5%) |
| 35 to 44 Years | 143,727 (90.5%) | 132,087 (85.1%) |
| 45 to 54 Years | 136,838 (91.5%) | 127,836 (88.0%) |
| 55 to 64 Years | 118,614 (88.5%) | 117,744 (87.6%) |
| 65 to 74 Years | 89,707 (90.4%) | 98,068 (89.4%) |
| 75 Years and over | 54,394 (91.0%) | 64,053 (88.4%) |
| Total | 987,227 (88.0%) | 955,499 (85.3%) |
Income Below Poverty Among Married-Couple Families in Clark County
The poverty statistics for married-couple families in Clark County show that 5.6% or 19,951 of the total 358,509 families live below the poverty line. Families with 5 or more children have the highest poverty rate of 24.2%, comprising of 668 families. On the other hand, families with no children have the lowest poverty rate of 3.9%, which includes 8,103 families.
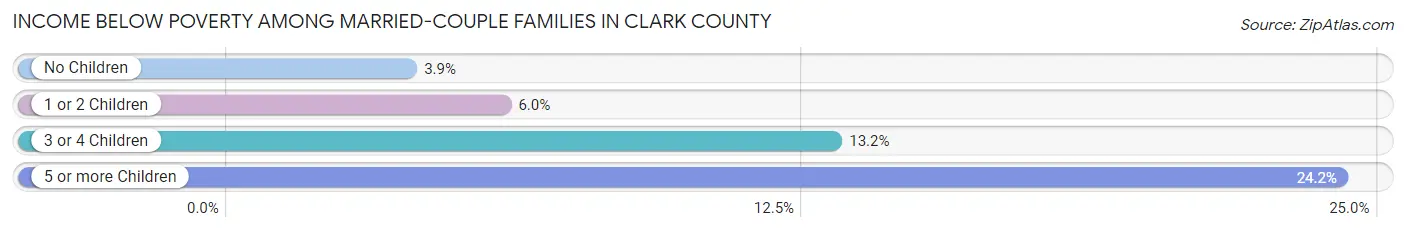
| Children | Above Poverty | Below Poverty |
| No Children | 199,772 (96.1%) | 8,103 (3.9%) |
| 1 or 2 Children | 108,000 (94.1%) | 6,836 (5.9%) |
| 3 or 4 Children | 28,690 (86.9%) | 4,344 (13.2%) |
| 5 or more Children | 2,096 (75.8%) | 668 (24.2%) |
| Total | 338,558 (94.4%) | 19,951 (5.6%) |
Income Below Poverty Among Single-Parent Households in Clark County
According to the poverty data in Clark County, 11.3% or 6,480 single-father households and 22.5% or 26,213 single-mother households are living below the poverty line. Among single-father households, those with 5 or more children have the highest poverty rate, with 215 households (40.9%) experiencing poverty. Likewise, among single-mother households, those with 5 or more children have the highest poverty rate, with 1,068 households (60.1%) falling below the poverty line.
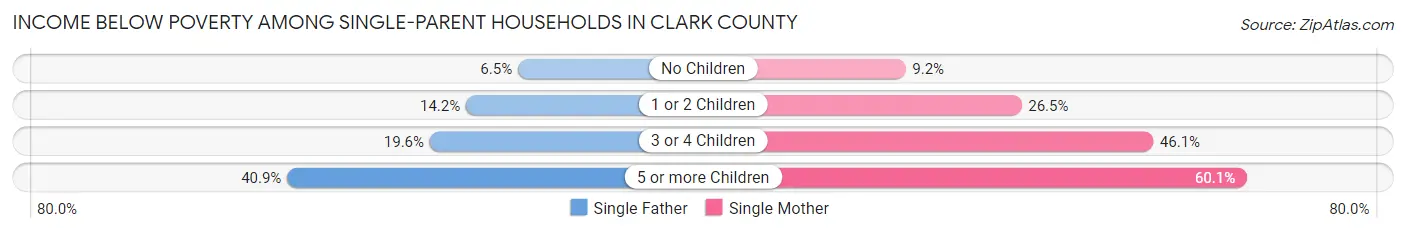
| Children | Single Father | Single Mother |
| No Children | 1,736 (6.5%) | 4,093 (9.2%) |
| 1 or 2 Children | 3,518 (14.2%) | 15,383 (26.5%) |
| 3 or 4 Children | 1,011 (19.6%) | 5,669 (46.1%) |
| 5 or more Children | 215 (40.9%) | 1,068 (60.1%) |
| Total | 6,480 (11.3%) | 26,213 (22.5%) |
Income Below Poverty Among Married-Couple vs Single-Parent Households in Clark County
The poverty data for Clark County shows that 19,951 of the married-couple family households (5.6%) and 32,693 of the single-parent households (18.8%) are living below the poverty level. Within the married-couple family households, those with 5 or more children have the highest poverty rate, with 668 households (24.2%) falling below the poverty line. Among the single-parent households, those with 5 or more children have the highest poverty rate, with 1,283 household (55.7%) living below poverty.
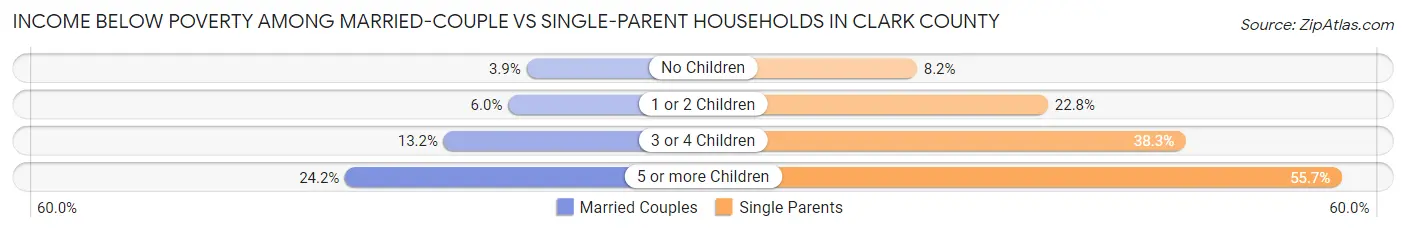
| Children | Married-Couple Families | Single-Parent Households |
| No Children | 8,103 (3.9%) | 5,829 (8.2%) |
| 1 or 2 Children | 6,836 (5.9%) | 18,901 (22.8%) |
| 3 or 4 Children | 4,344 (13.2%) | 6,680 (38.3%) |
| 5 or more Children | 668 (24.2%) | 1,283 (55.7%) |
| Total | 19,951 (5.6%) | 32,693 (18.8%) |
Race in Clark County
The most populous races in Clark County are White / Caucasian (1,130,071 | 49.9%), Hispanic or Latino (725,437 | 32.0%), and Two or more Races (305,978 | 13.5%).
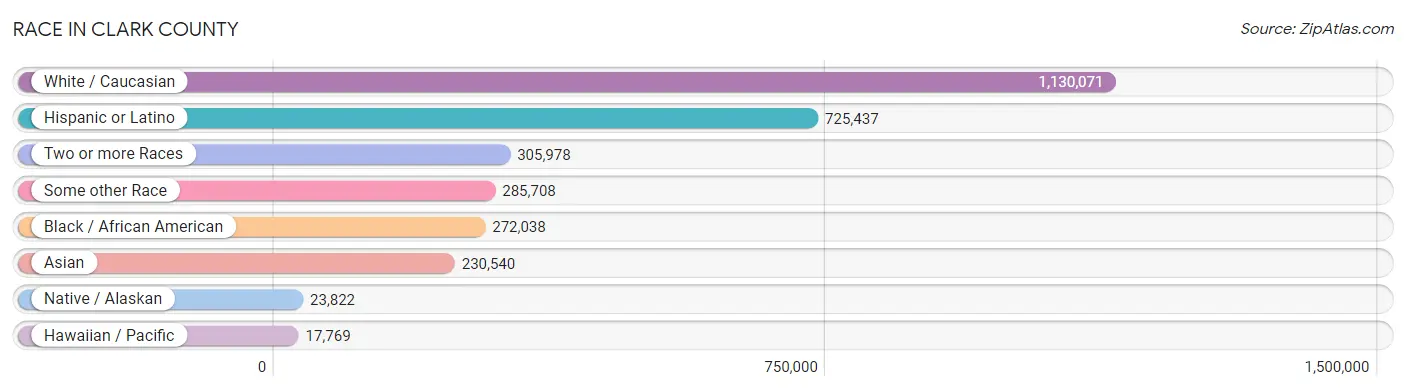
| Race | # Population | % Population |
| Asian | 230,540 | 10.2% |
| Black / African American | 272,038 | 12.0% |
| Hawaiian / Pacific | 17,769 | 0.8% |
| Hispanic or Latino | 725,437 | 32.0% |
| Native / Alaskan | 23,822 | 1.1% |
| White / Caucasian | 1,130,071 | 49.9% |
| Two or more Races | 305,978 | 13.5% |
| Some other Race | 285,708 | 12.6% |
| Total | 2,265,926 | 100.0% |
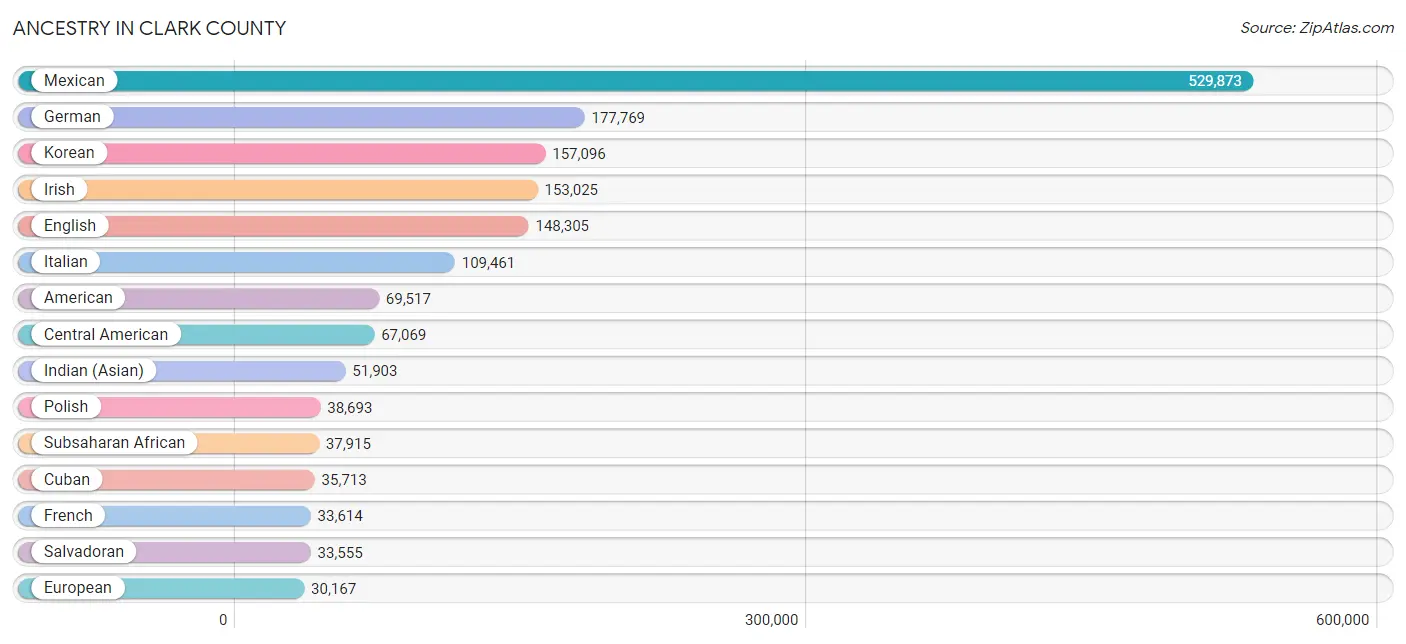
Ancestry in Clark County
The most populous ancestries reported in Clark County are Mexican (529,873 | 23.4%), German (177,769 | 7.9%), Korean (157,096 | 6.9%), Irish (153,025 | 6.8%), and English (148,305 | 6.6%), together accounting for 51.5% of all Clark County residents.
| Ancestry | # Population | % Population |
| Afghan | 401 | 0.0% |
| African | 20,792 | 0.9% |
| Alaska Native | 262 | 0.0% |
| Alaskan Athabascan | 7 | 0.0% |
| Albanian | 300 | 0.0% |
| Aleut | 25 | 0.0% |
| Alsatian | 5 | 0.0% |
| American | 69,517 | 3.1% |
| Apache | 2,275 | 0.1% |
| Arab | 12,452 | 0.5% |
| Arapaho | 28 | 0.0% |
| Argentinean | 3,612 | 0.2% |
| Armenian | 6,422 | 0.3% |
| Assyrian / Chaldean / Syriac | 351 | 0.0% |
| Australian | 972 | 0.0% |
| Austrian | 3,499 | 0.2% |
| Bahamian | 215 | 0.0% |
| Bangladeshi | 737 | 0.0% |
| Barbadian | 54 | 0.0% |
| Basque | 755 | 0.0% |
| Belgian | 1,482 | 0.1% |
| Belizean | 1,354 | 0.1% |
| Bermudan | 15 | 0.0% |
| Bhutanese | 26,199 | 1.2% |
| Blackfeet | 1,384 | 0.1% |
| Bolivian | 1,200 | 0.1% |
| Brazilian | 2,372 | 0.1% |
| British | 9,623 | 0.4% |
| British West Indian | 316 | 0.0% |
| Bulgarian | 1,662 | 0.1% |
| Burmese | 18,602 | 0.8% |
| Cajun | 217 | 0.0% |
| Cambodian | 276 | 0.0% |
| Canadian | 4,373 | 0.2% |
| Cape Verdean | 230 | 0.0% |
| Carpatho Rusyn | 22 | 0.0% |
| Celtic | 582 | 0.0% |
| Central American | 67,069 | 3.0% |
| Central American Indian | 3,460 | 0.2% |
| Cherokee | 7,368 | 0.3% |
| Cheyenne | 65 | 0.0% |
| Chickasaw | 347 | 0.0% |
| Chilean | 1,590 | 0.1% |
| Chinese | 147 | 0.0% |
| Chippewa | 417 | 0.0% |
| Choctaw | 1,786 | 0.1% |
| Colombian | 7,037 | 0.3% |
| Colville | 129 | 0.0% |
| Comanche | 451 | 0.0% |
| Costa Rican | 1,711 | 0.1% |
| Cree | 47 | 0.0% |
| Creek | 475 | 0.0% |
| Croatian | 2,369 | 0.1% |
| Crow | 23 | 0.0% |
| Cuban | 35,713 | 1.6% |
| Cypriot | 40 | 0.0% |
| Czech | 4,871 | 0.2% |
| Czechoslovakian | 1,357 | 0.1% |
| Danish | 9,861 | 0.4% |
| Delaware | 49 | 0.0% |
| Dominican | 4,326 | 0.2% |
| Dutch | 14,080 | 0.6% |
| Dutch West Indian | 57 | 0.0% |
| Eastern European | 4,509 | 0.2% |
| Ecuadorian | 2,793 | 0.1% |
| Egyptian | 1,476 | 0.1% |
| English | 148,305 | 6.6% |
| Estonian | 118 | 0.0% |
| Ethiopian | 12,182 | 0.5% |
| European | 30,167 | 1.3% |
| Fijian | 109 | 0.0% |
| Filipino | 2,279 | 0.1% |
| Finnish | 2,696 | 0.1% |
| French | 33,614 | 1.5% |
| French American Indian | 223 | 0.0% |
| French Canadian | 7,260 | 0.3% |
| German | 177,769 | 7.9% |
| German Russian | 250 | 0.0% |
| Ghanaian | 327 | 0.0% |
| Greek | 8,061 | 0.4% |
| Guamanian / Chamorro | 4,905 | 0.2% |
| Guatemalan | 16,679 | 0.7% |
| Guyanese | 112 | 0.0% |
| Haitian | 1,715 | 0.1% |
| Honduran | 5,547 | 0.2% |
| Hopi | 452 | 0.0% |
| Houma | 6 | 0.0% |
| Hungarian | 8,274 | 0.4% |
| Icelander | 422 | 0.0% |
| Indian (Asian) | 51,903 | 2.3% |
| Indonesian | 130 | 0.0% |
| Inupiat | 109 | 0.0% |
| Iranian | 5,305 | 0.2% |
| Iraqi | 1,048 | 0.1% |
| Irish | 153,025 | 6.8% |
| Iroquois | 454 | 0.0% |
| Israeli | 2,596 | 0.1% |
| Italian | 109,461 | 4.8% |
| Jamaican | 3,412 | 0.2% |
| Japanese | 2,103 | 0.1% |
| Jordanian | 305 | 0.0% |
| Kenyan | 323 | 0.0% |
| Kiowa | 138 | 0.0% |
| Korean | 157,096 | 6.9% |
| Laotian | 1,776 | 0.1% |
| Latvian | 516 | 0.0% |
| Lebanese | 3,450 | 0.2% |
| Liberian | 276 | 0.0% |
| Lithuanian | 2,809 | 0.1% |
| Luxembourger | 173 | 0.0% |
| Macedonian | 205 | 0.0% |
| Malaysian | 3,580 | 0.2% |
| Maltese | 343 | 0.0% |
| Menominee | 121 | 0.0% |
| Mexican | 529,873 | 23.4% |
| Mexican American Indian | 11,430 | 0.5% |
| Mongolian | 259 | 0.0% |
| Moroccan | 1,574 | 0.1% |
| Native Hawaiian | 20,518 | 0.9% |
| Navajo | 2,333 | 0.1% |
| Nepalese | 217 | 0.0% |
| New Zealander | 325 | 0.0% |
| Nicaraguan | 5,766 | 0.3% |
| Nigerian | 2,023 | 0.1% |
| Northern European | 1,869 | 0.1% |
| Norwegian | 20,562 | 0.9% |
| Okinawan | 74 | 0.0% |
| Osage | 216 | 0.0% |
| Ottawa | 9 | 0.0% |
| Paiute | 1,354 | 0.1% |
| Pakistani | 8,641 | 0.4% |
| Palestinian | 800 | 0.0% |
| Panamanian | 2,722 | 0.1% |
| Paraguayan | 105 | 0.0% |
| Pennsylvania German | 492 | 0.0% |
| Peruvian | 6,586 | 0.3% |
| Pima | 62 | 0.0% |
| Polish | 38,693 | 1.7% |
| Portuguese | 10,048 | 0.4% |
| Potawatomi | 165 | 0.0% |
| Pueblo | 489 | 0.0% |
| Puerto Rican | 25,004 | 1.1% |
| Puget Sound Salish | 33 | 0.0% |
| Romanian | 4,498 | 0.2% |
| Russian | 17,092 | 0.7% |
| Salvadoran | 33,555 | 1.5% |
| Samoan | 7,347 | 0.3% |
| Scandinavian | 6,416 | 0.3% |
| Scotch-Irish | 8,836 | 0.4% |
| Scottish | 27,156 | 1.2% |
| Seminole | 194 | 0.0% |
| Senegalese | 63 | 0.0% |
| Serbian | 3,337 | 0.2% |
| Shoshone | 407 | 0.0% |
| Sierra Leonean | 160 | 0.0% |
| Sioux | 1,100 | 0.1% |
| Slavic | 718 | 0.0% |
| Slovak | 2,130 | 0.1% |
| Slovene | 649 | 0.0% |
| Somali | 155 | 0.0% |
| South African | 448 | 0.0% |
| South American | 26,572 | 1.2% |
| South American Indian | 472 | 0.0% |
| Soviet Union | 18 | 0.0% |
| Spaniard | 9,916 | 0.4% |
| Spanish | 8,558 | 0.4% |
| Spanish American | 363 | 0.0% |
| Spanish American Indian | 34 | 0.0% |
| Sri Lankan | 16,590 | 0.7% |
| Subsaharan African | 37,915 | 1.7% |
| Sudanese | 183 | 0.0% |
| Swedish | 17,489 | 0.8% |
| Swiss | 6,013 | 0.3% |
| Syrian | 1,264 | 0.1% |
| Thai | 14,913 | 0.7% |
| Tlingit-Haida | 149 | 0.0% |
| Tohono O'Odham | 71 | 0.0% |
| Tongan | 513 | 0.0% |
| Trinidadian and Tobagonian | 685 | 0.0% |
| Turkish | 1,142 | 0.1% |
| U.S. Virgin Islander | 113 | 0.0% |
| Ugandan | 155 | 0.0% |
| Ukrainian | 4,501 | 0.2% |
| Uruguayan | 552 | 0.0% |
| Ute | 181 | 0.0% |
| Venezuelan | 3,000 | 0.1% |
| Vietnamese | 265 | 0.0% |
| Welsh | 9,098 | 0.4% |
| West Indian | 845 | 0.0% |
| Yakama | 5 | 0.0% |
| Yaqui | 279 | 0.0% |
| Yugoslavian | 1,760 | 0.1% |
| Yuman | 115 | 0.0% |
| Yup'ik | 72 | 0.0% |
| Zimbabwean | 93 | 0.0% | View All 195 Rows |
Immigrants in Clark County
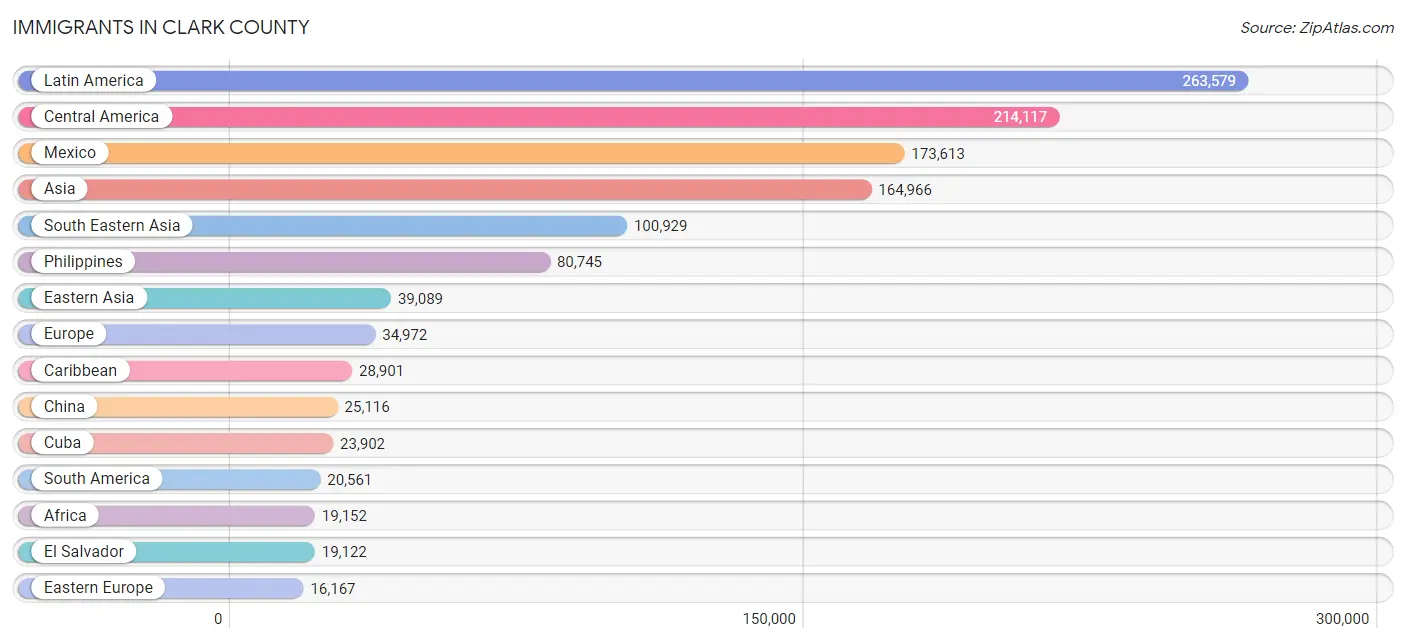
The most numerous immigrant groups reported in Clark County came from Latin America (263,579 | 11.6%), Central America (214,117 | 9.5%), Mexico (173,613 | 7.7%), Asia (164,966 | 7.3%), and South Eastern Asia (100,929 | 4.4%), together accounting for 40.5% of all Clark County residents.
| Immigration Origin | # Population | % Population |
| Afghanistan | 487 | 0.0% |
| Africa | 19,152 | 0.9% |
| Albania | 304 | 0.0% |
| Argentina | 2,618 | 0.1% |
| Armenia | 2,154 | 0.1% |
| Asia | 164,966 | 7.3% |
| Australia | 1,125 | 0.1% |
| Austria | 373 | 0.0% |
| Azores | 43 | 0.0% |
| Bahamas | 143 | 0.0% |
| Bangladesh | 159 | 0.0% |
| Barbados | 30 | 0.0% |
| Belarus | 159 | 0.0% |
| Belgium | 297 | 0.0% |
| Belize | 817 | 0.0% |
| Bolivia | 630 | 0.0% |
| Bosnia and Herzegovina | 1,455 | 0.1% |
| Brazil | 3,124 | 0.1% |
| Bulgaria | 1,470 | 0.1% |
| Cambodia | 871 | 0.0% |
| Cameroon | 144 | 0.0% |
| Canada | 8,535 | 0.4% |
| Caribbean | 28,901 | 1.3% |
| Central America | 214,117 | 9.5% |
| Chile | 968 | 0.0% |
| China | 25,116 | 1.1% |
| Colombia | 4,047 | 0.2% |
| Congo | 16 | 0.0% |
| Costa Rica | 976 | 0.0% |
| Croatia | 505 | 0.0% |
| Cuba | 23,902 | 1.1% |
| Czechoslovakia | 532 | 0.0% |
| Denmark | 413 | 0.0% |
| Dominica | 34 | 0.0% |
| Dominican Republic | 1,300 | 0.1% |
| Eastern Africa | 12,937 | 0.6% |
| Eastern Asia | 39,089 | 1.7% |
| Eastern Europe | 16,167 | 0.7% |
| Ecuador | 1,199 | 0.1% |
| Egypt | 1,060 | 0.1% |
| El Salvador | 19,122 | 0.8% |
| England | 2,986 | 0.1% |
| Eritrea | 937 | 0.0% |
| Ethiopia | 10,287 | 0.4% |
| Europe | 34,972 | 1.5% |
| Fiji | 451 | 0.0% |
| France | 1,613 | 0.1% |
| Germany | 4,521 | 0.2% |
| Ghana | 211 | 0.0% |
| Greece | 602 | 0.0% |
| Grenada | 18 | 0.0% |
| Guatemala | 10,891 | 0.5% |
| Guyana | 180 | 0.0% |
| Haiti | 680 | 0.0% |
| Honduras | 4,142 | 0.2% |
| Hong Kong | 2,454 | 0.1% |
| Hungary | 1,314 | 0.1% |
| India | 6,872 | 0.3% |
| Indonesia | 1,055 | 0.1% |
| Iran | 4,358 | 0.2% |
| Iraq | 1,352 | 0.1% |
| Ireland | 407 | 0.0% |
| Israel | 2,239 | 0.1% |
| Italy | 1,668 | 0.1% |
| Jamaica | 1,638 | 0.1% |
| Japan | 4,099 | 0.2% |
| Jordan | 409 | 0.0% |
| Kazakhstan | 198 | 0.0% |
| Kenya | 697 | 0.0% |
| Korea | 9,773 | 0.4% |
| Kuwait | 12 | 0.0% |
| Laos | 1,451 | 0.1% |
| Latin America | 263,579 | 11.6% |
| Latvia | 286 | 0.0% |
| Lebanon | 1,234 | 0.1% |
| Liberia | 198 | 0.0% |
| Lithuania | 276 | 0.0% |
| Malaysia | 646 | 0.0% |
| Mexico | 173,613 | 7.7% |
| Micronesia | 183 | 0.0% |
| Middle Africa | 353 | 0.0% |
| Moldova | 210 | 0.0% |
| Morocco | 891 | 0.0% |
| Nepal | 461 | 0.0% |
| Netherlands | 689 | 0.0% |
| Nicaragua | 3,395 | 0.2% |
| Nigeria | 1,294 | 0.1% |
| North Macedonia | 197 | 0.0% |
| Northern Africa | 2,483 | 0.1% |
| Northern Europe | 7,705 | 0.3% |
| Norway | 152 | 0.0% |
| Oceania | 3,270 | 0.1% |
| Pakistan | 1,175 | 0.1% |
| Panama | 1,117 | 0.1% |
| Peru | 5,107 | 0.2% |
| Philippines | 80,745 | 3.6% |
| Poland | 1,807 | 0.1% |
| Portugal | 430 | 0.0% |
| Romania | 2,107 | 0.1% |
| Russia | 2,584 | 0.1% |
| Saudi Arabia | 372 | 0.0% |
| Scotland | 605 | 0.0% |
| Senegal | 150 | 0.0% |
| Serbia | 633 | 0.0% |
| Sierra Leone | 88 | 0.0% |
| Singapore | 446 | 0.0% |
| Somalia | 186 | 0.0% |
| South Africa | 652 | 0.0% |
| South America | 20,561 | 0.9% |
| South Central Asia | 14,965 | 0.7% |
| South Eastern Asia | 100,929 | 4.4% |
| Southern Europe | 3,159 | 0.1% |
| Spain | 419 | 0.0% |
| Sri Lanka | 512 | 0.0% |
| Sudan | 238 | 0.0% |
| Sweden | 379 | 0.0% |
| Switzerland | 287 | 0.0% |
| Syria | 748 | 0.0% |
| Taiwan | 4,671 | 0.2% |
| Thailand | 5,387 | 0.2% |
| Trinidad and Tobago | 681 | 0.0% |
| Turkey | 712 | 0.0% |
| Uganda | 342 | 0.0% |
| Ukraine | 1,553 | 0.1% |
| Uruguay | 256 | 0.0% |
| Uzbekistan | 233 | 0.0% |
| Venezuela | 2,165 | 0.1% |
| Vietnam | 10,114 | 0.4% |
| West Indies | 210 | 0.0% |
| Western Africa | 2,310 | 0.1% |
| Western Asia | 9,732 | 0.4% |
| Western Europe | 7,810 | 0.3% |
| Yemen | 59 | 0.0% |
| Zaire | 131 | 0.0% |
| Zimbabwe | 287 | 0.0% | View All 135 Rows |
Sex and Age in Clark County
Sex and Age in Clark County
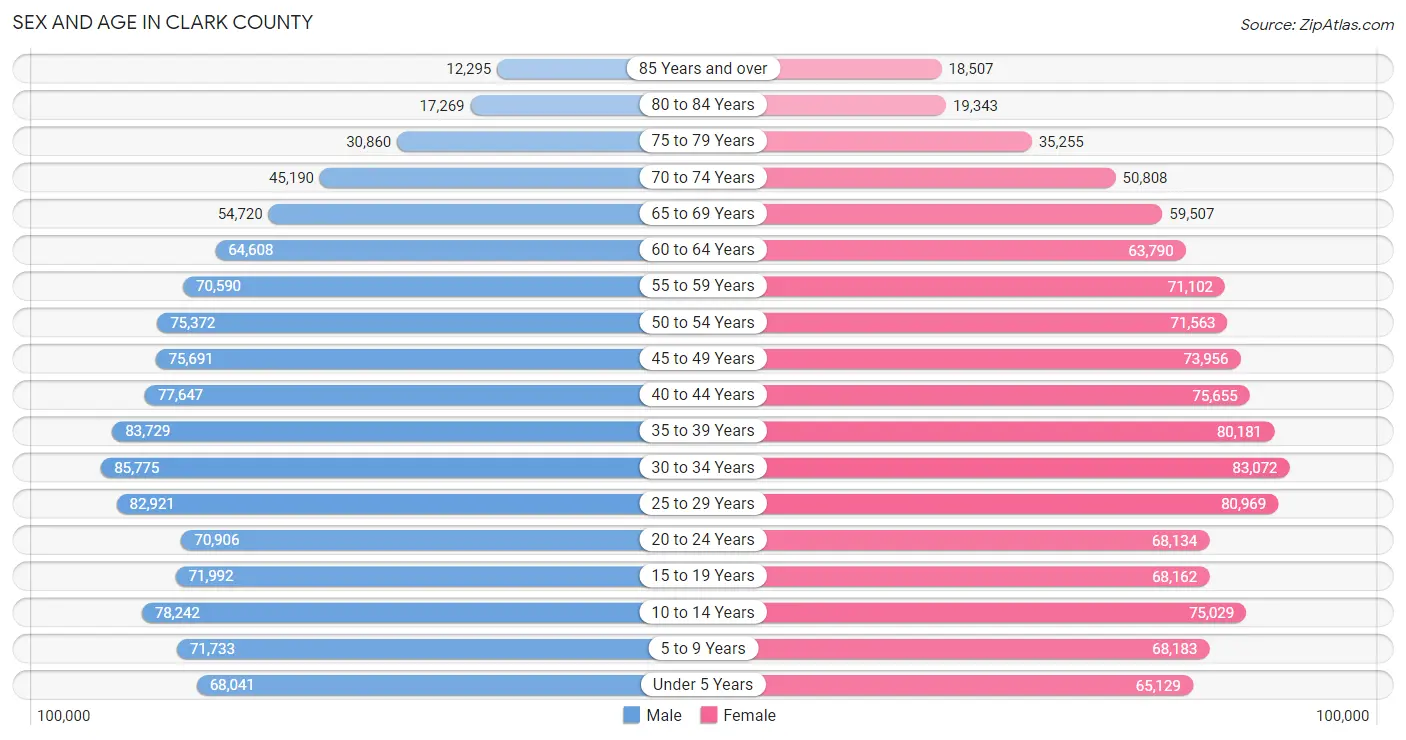
The most populous age groups in Clark County are 30 to 34 Years (85,775 | 7.5%) for men and 30 to 34 Years (83,072 | 7.4%) for women.
| Age Bracket | Male | Female |
| Under 5 Years | 68,041 (6.0%) | 65,129 (5.8%) |
| 5 to 9 Years | 71,733 (6.3%) | 68,183 (6.0%) |
| 10 to 14 Years | 78,242 (6.9%) | 75,029 (6.7%) |
| 15 to 19 Years | 71,992 (6.3%) | 68,162 (6.0%) |
| 20 to 24 Years | 70,906 (6.2%) | 68,134 (6.0%) |
| 25 to 29 Years | 82,921 (7.3%) | 80,969 (7.2%) |
| 30 to 34 Years | 85,775 (7.5%) | 83,072 (7.4%) |
| 35 to 39 Years | 83,729 (7.4%) | 80,181 (7.1%) |
| 40 to 44 Years | 77,647 (6.8%) | 75,655 (6.7%) |
| 45 to 49 Years | 75,691 (6.7%) | 73,956 (6.6%) |
| 50 to 54 Years | 75,372 (6.6%) | 71,563 (6.3%) |
| 55 to 59 Years | 70,590 (6.2%) | 71,102 (6.3%) |
| 60 to 64 Years | 64,608 (5.7%) | 63,790 (5.7%) |
| 65 to 69 Years | 54,720 (4.8%) | 59,507 (5.3%) |
| 70 to 74 Years | 45,190 (4.0%) | 50,808 (4.5%) |
| 75 to 79 Years | 30,860 (2.7%) | 35,255 (3.1%) |
| 80 to 84 Years | 17,269 (1.5%) | 19,343 (1.7%) |
| 85 Years and over | 12,295 (1.1%) | 18,507 (1.6%) |
| Total | 1,137,581 (100.0%) | 1,128,345 (100.0%) |
Families and Households in Clark County
Median Family Size in Clark County
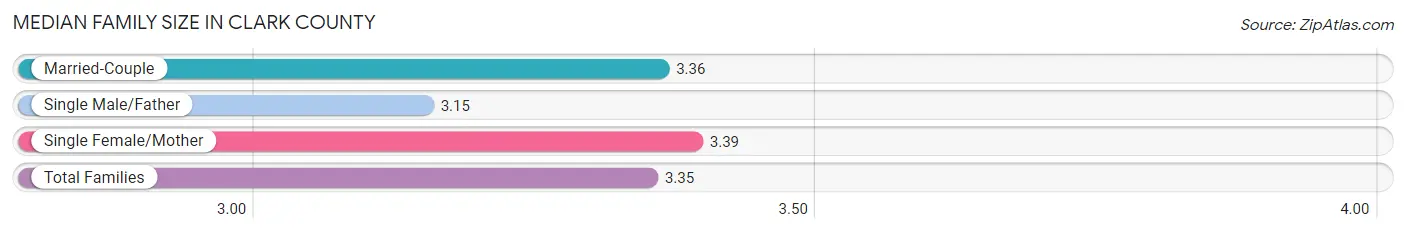
The median family size in Clark County is 3.35 persons per family, with single female/mother families (116,737 | 21.9%) accounting for the largest median family size of 3.39 persons per family. On the other hand, single male/father families (57,188 | 10.7%) represent the smallest median family size with 3.15 persons per family.
| Family Type | # Families | Family Size |
| Married-Couple | 358,509 (67.3%) | 3.36 |
| Single Male/Father | 57,188 (10.7%) | 3.15 |
| Single Female/Mother | 116,737 (21.9%) | 3.39 |
| Total Families | 532,434 (100.0%) | 3.35 |
Median Household Size in Clark County
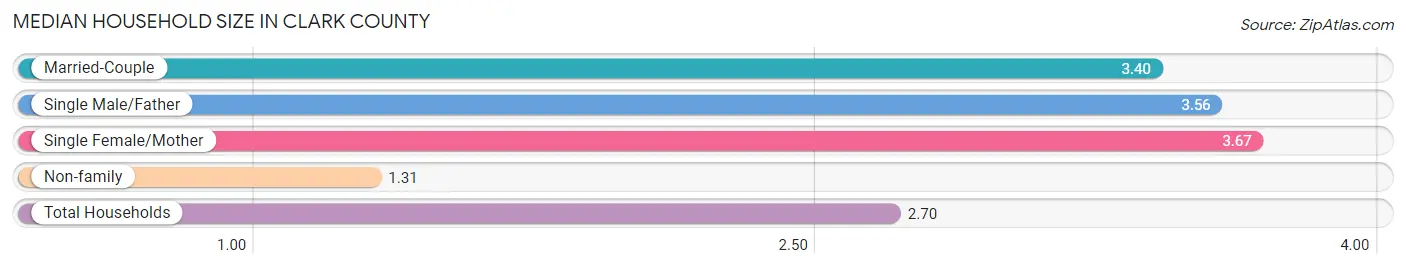
The median household size in Clark County is 2.70 persons per household, with single female/mother households (116,737 | 14.0%) accounting for the largest median household size of 3.67 persons per household. non-family households (299,933 | 36.0%) represent the smallest median household size with 1.31 persons per household.
| Household Type | # Households | Household Size |
| Married-Couple | 358,509 (43.1%) | 3.40 |
| Single Male/Father | 57,188 (6.9%) | 3.56 |
| Single Female/Mother | 116,737 (14.0%) | 3.67 |
| Non-family | 299,933 (36.0%) | 1.31 |
| Total Households | 832,367 (100.0%) | 2.70 |
Household Size by Marriage Status in Clark County
Out of a total of 832,367 households in Clark County, 532,434 (64.0%) are family households, while 299,933 (36.0%) are nonfamily households. The most numerous type of family households are 2-person households, comprising 215,246, and the most common type of nonfamily households are 1-person households, comprising 233,353.
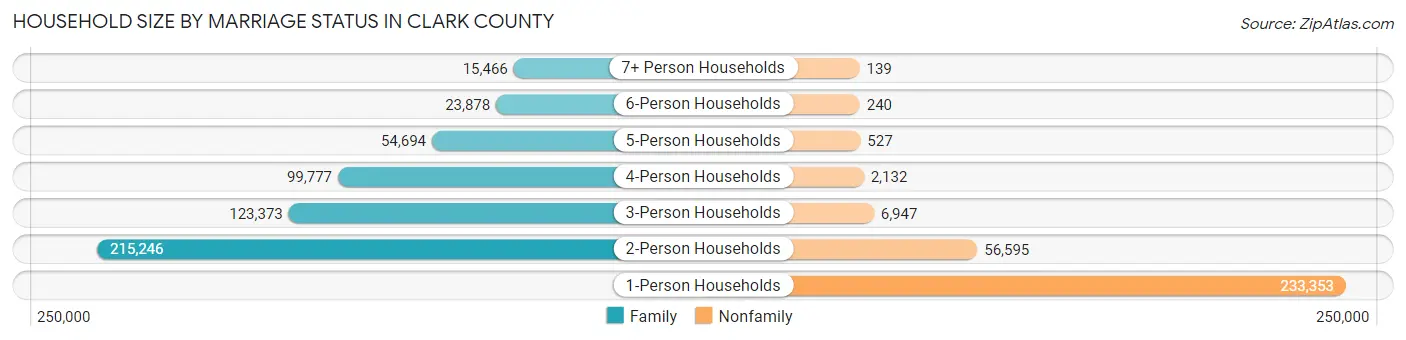
| Household Size | Family Households | Nonfamily Households |
| 1-Person Households | - | 233,353 (28.0%) |
| 2-Person Households | 215,246 (25.9%) | 56,595 (6.8%) |
| 3-Person Households | 123,373 (14.8%) | 6,947 (0.8%) |
| 4-Person Households | 99,777 (12.0%) | 2,132 (0.3%) |
| 5-Person Households | 54,694 (6.6%) | 527 (0.1%) |
| 6-Person Households | 23,878 (2.9%) | 240 (0.0%) |
| 7+ Person Households | 15,466 (1.9%) | 139 (0.0%) |
| Total | 532,434 (64.0%) | 299,933 (36.0%) |
Female Fertility in Clark County
Fertility by Age in Clark County
Average fertility rate in Clark County is 50.0 births per 1,000 women. Women in the age bracket of 20 to 34 years have the highest fertility rate with 80.0 births per 1,000 women. Women in the age bracket of 20 to 34 years acount for 68.5% of all women with births.
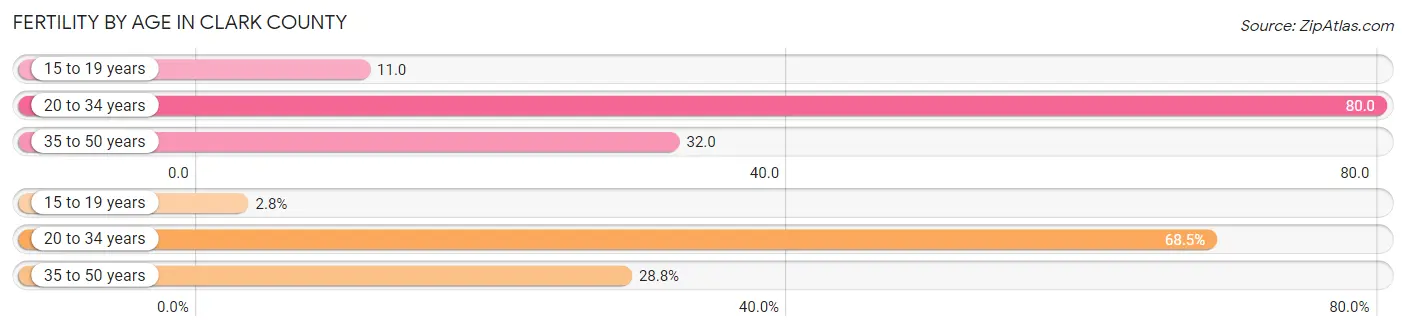
| Age Bracket | Women with Births | Births / 1,000 Women |
| 15 to 19 years | 742 (2.8%) | 11.0 |
| 20 to 34 years | 18,476 (68.5%) | 80.0 |
| 35 to 50 years | 7,764 (28.8%) | 32.0 |
| Total | 26,982 (100.0%) | 50.0 |
Fertility by Age by Marriage Status in Clark County
61.4% of women with births (26,982) in Clark County are married. The highest percentage of unmarried women with births falls into 15 to 19 years age bracket with 86.1% of them unmarried at the time of birth, while the lowest percentage of unmarried women with births belong to 35 to 50 years age bracket with 31.0% of them unmarried.
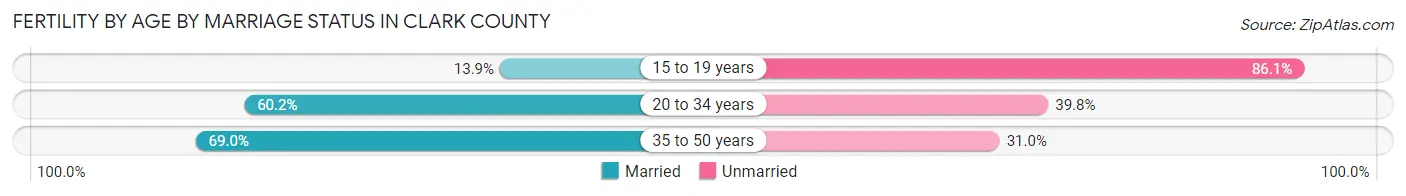
| Age Bracket | Married | Unmarried |
| 15 to 19 years | 103 (13.9%) | 639 (86.1%) |
| 20 to 34 years | 11,123 (60.2%) | 7,353 (39.8%) |
| 35 to 50 years | 5,357 (69.0%) | 2,407 (31.0%) |
| Total | 16,567 (61.4%) | 10,415 (38.6%) |
Fertility by Education in Clark County
Average fertility rate in Clark County is 50.0 births per 1,000 women. Women with the education attainment of graduate degree have the highest fertility rate of 60.0 births per 1,000 women, while women with the education attainment of less than high school have the lowest fertility at 40.0 births per 1,000 women. Women with the education attainment of college or associate's degree represent 31.5% of all women with births.
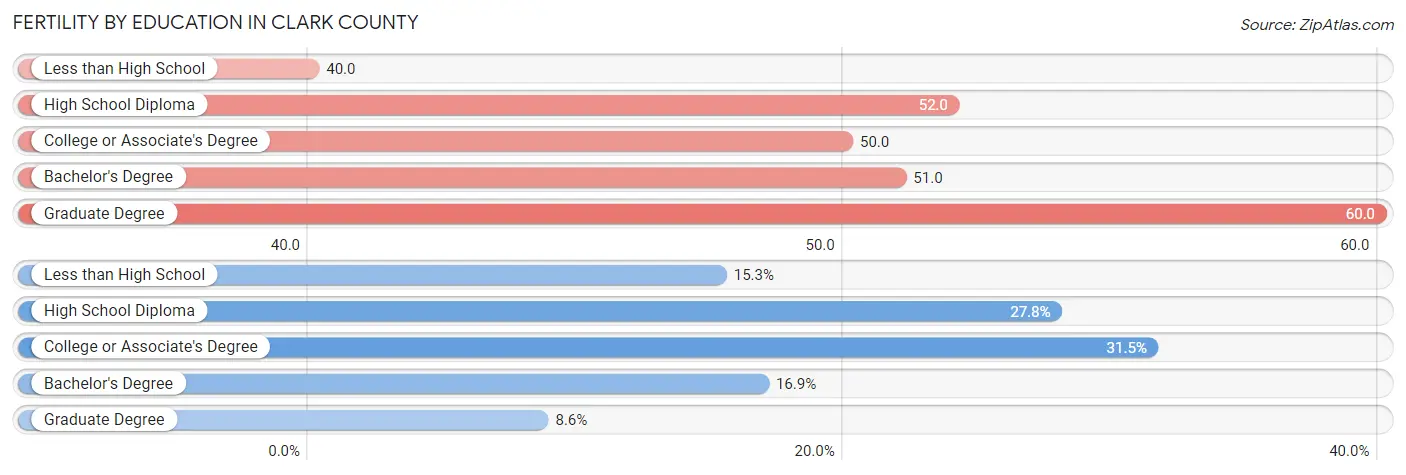
| Educational Attainment | Women with Births | Births / 1,000 Women |
| Less than High School | 4,119 (15.3%) | 40.0 |
| High School Diploma | 7,513 (27.8%) | 52.0 |
| College or Associate's Degree | 8,485 (31.5%) | 50.0 |
| Bachelor's Degree | 4,547 (16.9%) | 51.0 |
| Graduate Degree | 2,318 (8.6%) | 60.0 |
| Total | 26,982 (100.0%) | 50.0 |
Fertility by Education by Marriage Status in Clark County
38.6% of women with births in Clark County are unmarried. Women with the educational attainment of graduate degree are most likely to be married with 89.3% of them married at childbirth, while women with the educational attainment of high school diploma are least likely to be married with 56.2% of them unmarried at childbirth.
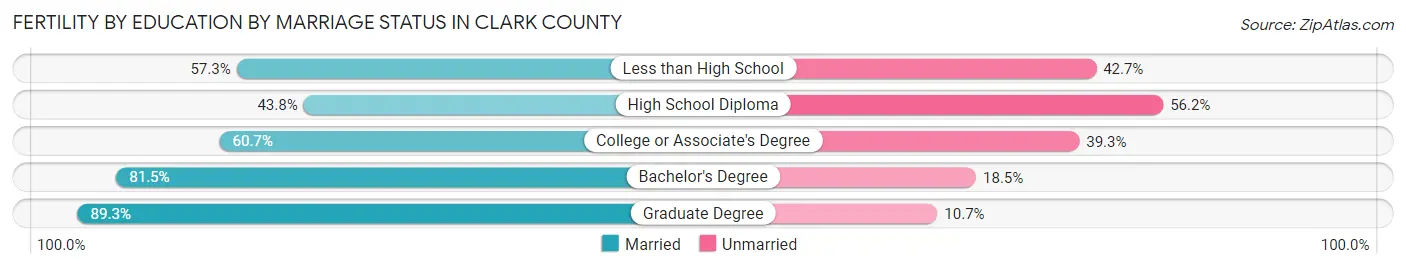
| Educational Attainment | Married | Unmarried |
| Less than High School | 2,360 (57.3%) | 1,759 (42.7%) |
| High School Diploma | 3,291 (43.8%) | 4,222 (56.2%) |
| College or Associate's Degree | 5,150 (60.7%) | 3,335 (39.3%) |
| Bachelor's Degree | 3,706 (81.5%) | 841 (18.5%) |
| Graduate Degree | 2,070 (89.3%) | 248 (10.7%) |
| Total | 16,567 (61.4%) | 10,415 (38.6%) |
Employment Characteristics in Clark County
Employment by Class of Employer in Clark County
Among the 1,040,510 employed individuals in Clark County, private company employees (781,577 | 75.1%), local government employees (66,752 | 6.4%), and self-employed (not incorporated) (55,665 | 5.3%) make up the most common classes of employment.
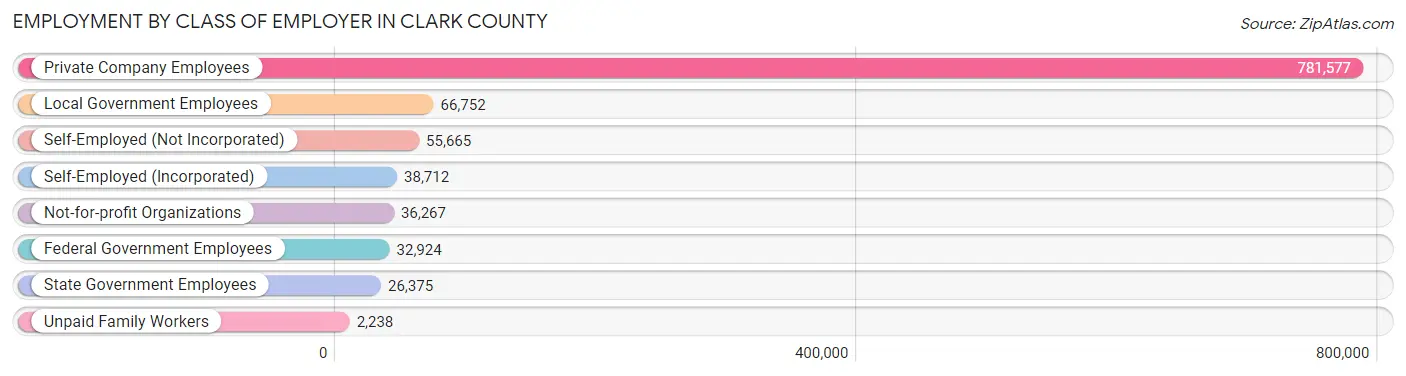
| Employer Class | # Employees | % Employees |
| Private Company Employees | 781,577 | 75.1% |
| Self-Employed (Incorporated) | 38,712 | 3.7% |
| Self-Employed (Not Incorporated) | 55,665 | 5.3% |
| Not-for-profit Organizations | 36,267 | 3.5% |
| Local Government Employees | 66,752 | 6.4% |
| State Government Employees | 26,375 | 2.5% |
| Federal Government Employees | 32,924 | 3.2% |
| Unpaid Family Workers | 2,238 | 0.2% |
| Total | 1,040,510 | 100.0% |
Employment Status by Age in Clark County
According to the labor force statistics for Clark County, out of the total population over 16 years of age (1,809,986), 63.8% or 1,154,771 individuals are in the labor force, with 7.7% or 88,917 of them unemployed. The age group with the highest labor force participation rate is 30 to 34 years, with 83.1% or 140,312 individuals in the labor force. Within the labor force, the 16 to 19 years age range has the highest percentage of unemployed individuals, with 18.7% or 7,775 of them being unemployed.
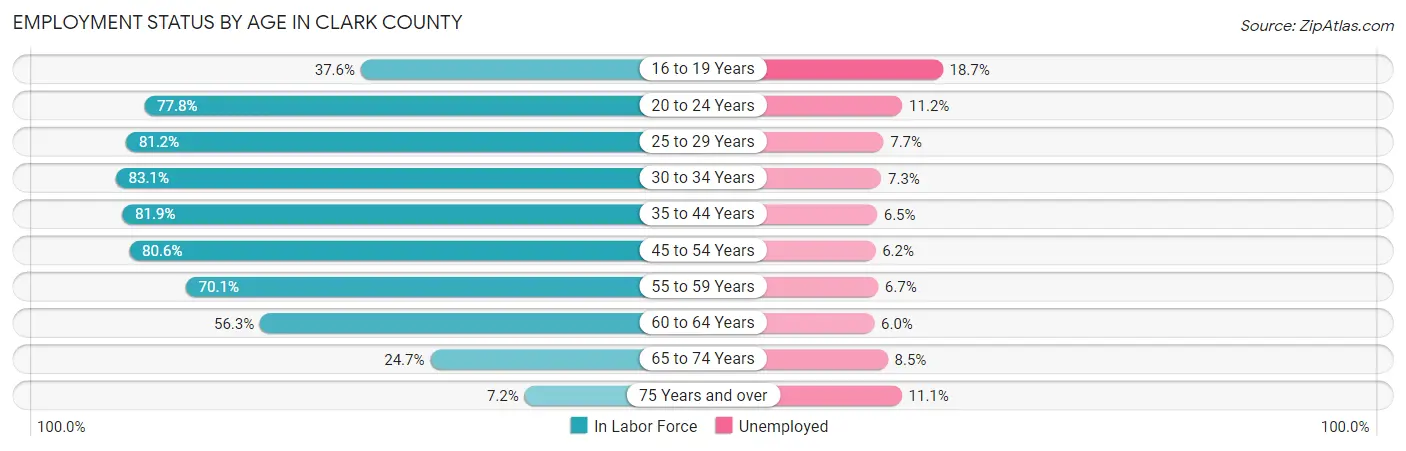
| Age Bracket | In Labor Force | Unemployed |
| 16 to 19 Years | 41,575 (37.6%) | 7,775 (18.7%) |
| 20 to 24 Years | 108,173 (77.8%) | 12,115 (11.2%) |
| 25 to 29 Years | 133,079 (81.2%) | 10,247 (7.7%) |
| 30 to 34 Years | 140,312 (83.1%) | 10,243 (7.3%) |
| 35 to 44 Years | 259,797 (81.9%) | 16,887 (6.5%) |
| 45 to 54 Years | 239,045 (80.6%) | 14,821 (6.2%) |
| 55 to 59 Years | 99,326 (70.1%) | 6,655 (6.7%) |
| 60 to 64 Years | 72,288 (56.3%) | 4,337 (6.0%) |
| 65 to 74 Years | 51,926 (24.7%) | 4,414 (8.5%) |
| 75 Years and over | 9,614 (7.2%) | 1,067 (11.1%) |
| Total | 1,154,771 (63.8%) | 88,917 (7.7%) |
Employment Status by Educational Attainment in Clark County
According to labor force statistics for Clark County, 77.6% of individuals (944,098) out of the total population between 25 and 64 years of age (1,216,621) are in the labor force, with 6.7% or 63,255 of them being unemployed. The group with the highest labor force participation rate are those with the educational attainment of bachelor's degree or higher, with 84.2% or 267,634 individuals in the labor force. Within the labor force, individuals with high school diploma education have the highest percentage of unemployment, with 8.2% or 20,837 of them being unemployed.
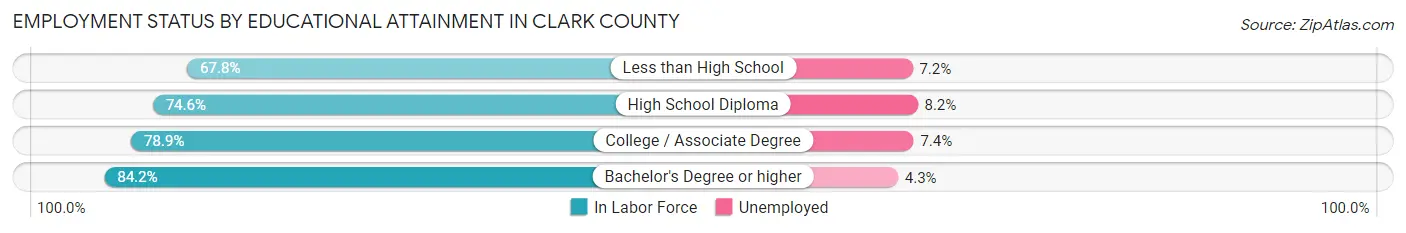
| Educational Attainment | In Labor Force | Unemployed |
| Less than High School | 113,075 (67.8%) | 12,008 (7.2%) |
| High School Diploma | 254,104 (74.6%) | 27,931 (8.2%) |
| College / Associate Degree | 308,789 (78.9%) | 28,961 (7.4%) |
| Bachelor's Degree or higher | 267,634 (84.2%) | 13,668 (4.3%) |
| Total | 944,098 (77.6%) | 81,514 (6.7%) |
Employment Occupations by Sex in Clark County
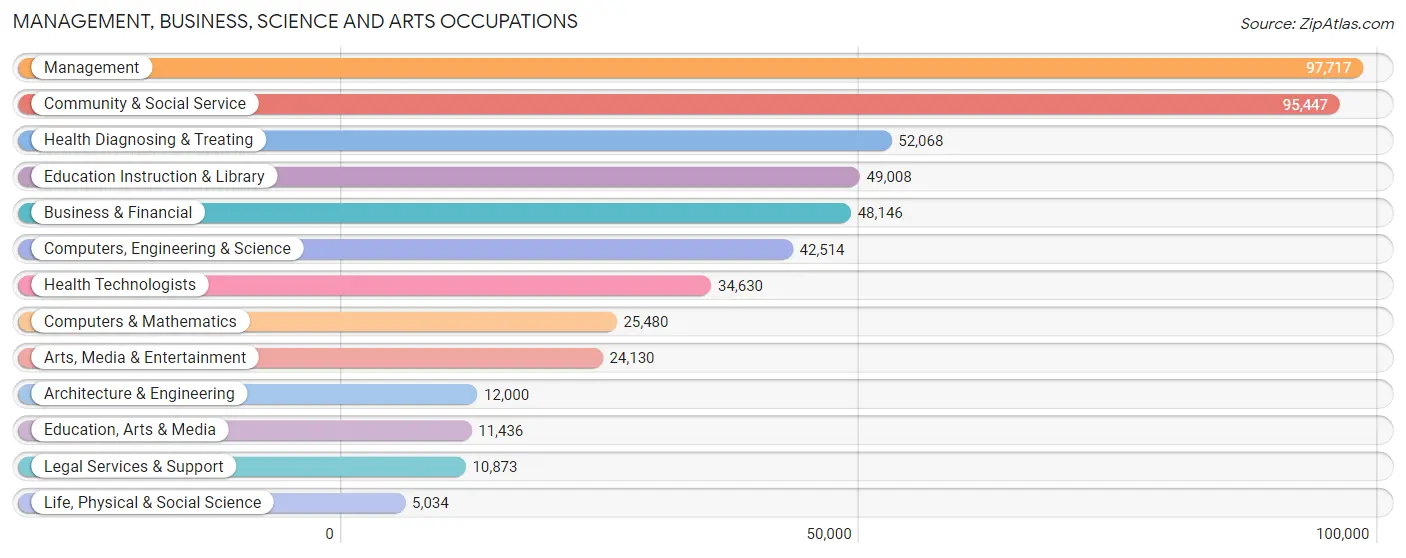
Management, Business, Science and Arts Occupations
The most common Management, Business, Science and Arts occupations in Clark County are Management (97,717 | 9.2%), Community & Social Service (95,447 | 9.0%), Health Diagnosing & Treating (52,068 | 4.9%), Education Instruction & Library (49,008 | 4.6%), and Business & Financial (48,146 | 4.5%).
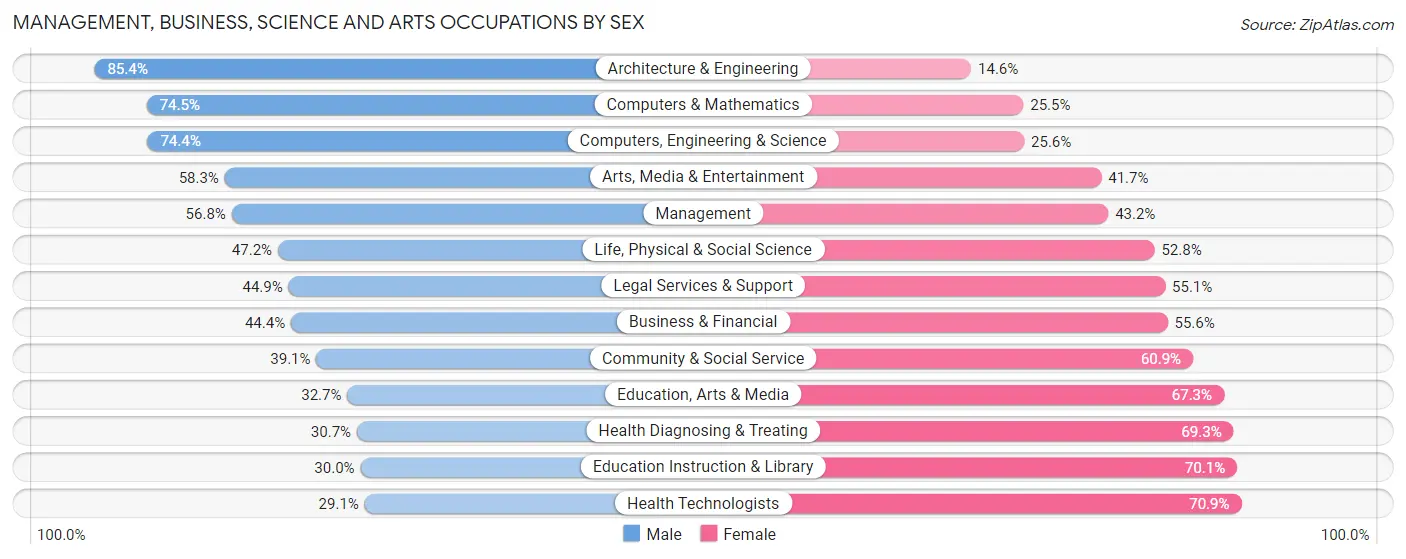
Management, Business, Science and Arts Occupations by Sex
Within the Management, Business, Science and Arts occupations in Clark County, the most male-oriented occupations are Architecture & Engineering (85.4%), Computers & Mathematics (74.5%), and Computers, Engineering & Science (74.4%), while the most female-oriented occupations are Health Technologists (70.9%), Education Instruction & Library (70.1%), and Health Diagnosing & Treating (69.3%).
| Occupation | Male | Female |
| Management | 55,516 (56.8%) | 42,201 (43.2%) |
| Business & Financial | 21,392 (44.4%) | 26,754 (55.6%) |
| Computers, Engineering & Science | 31,612 (74.4%) | 10,902 (25.6%) |
| Computers & Mathematics | 18,989 (74.5%) | 6,491 (25.5%) |
| Architecture & Engineering | 10,249 (85.4%) | 1,751 (14.6%) |
| Life, Physical & Social Science | 2,374 (47.2%) | 2,660 (52.8%) |
| Community & Social Service | 37,358 (39.1%) | 58,089 (60.9%) |
| Education, Arts & Media | 3,738 (32.7%) | 7,698 (67.3%) |
| Legal Services & Support | 4,886 (44.9%) | 5,987 (55.1%) |
| Education Instruction & Library | 14,676 (29.9%) | 34,332 (70.1%) |
| Arts, Media & Entertainment | 14,058 (58.3%) | 10,072 (41.7%) |
| Health Diagnosing & Treating | 15,973 (30.7%) | 36,095 (69.3%) |
| Health Technologists | 10,063 (29.1%) | 24,567 (70.9%) |
| Total (Category) | 161,851 (48.2%) | 174,041 (51.8%) |
| Total (Overall) | 567,370 (53.7%) | 489,895 (46.3%) |
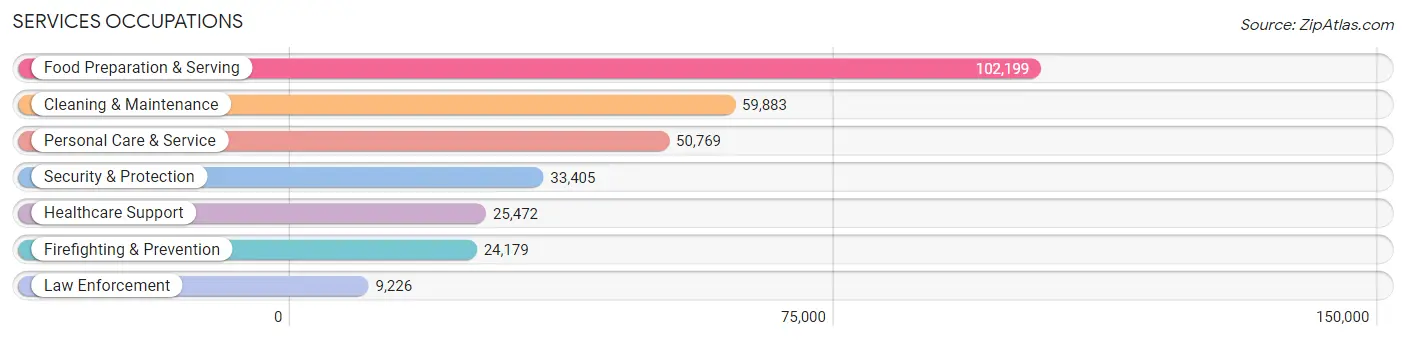
Services Occupations
The most common Services occupations in Clark County are Food Preparation & Serving (102,199 | 9.7%), Cleaning & Maintenance (59,883 | 5.7%), Personal Care & Service (50,769 | 4.8%), Security & Protection (33,405 | 3.2%), and Healthcare Support (25,472 | 2.4%).
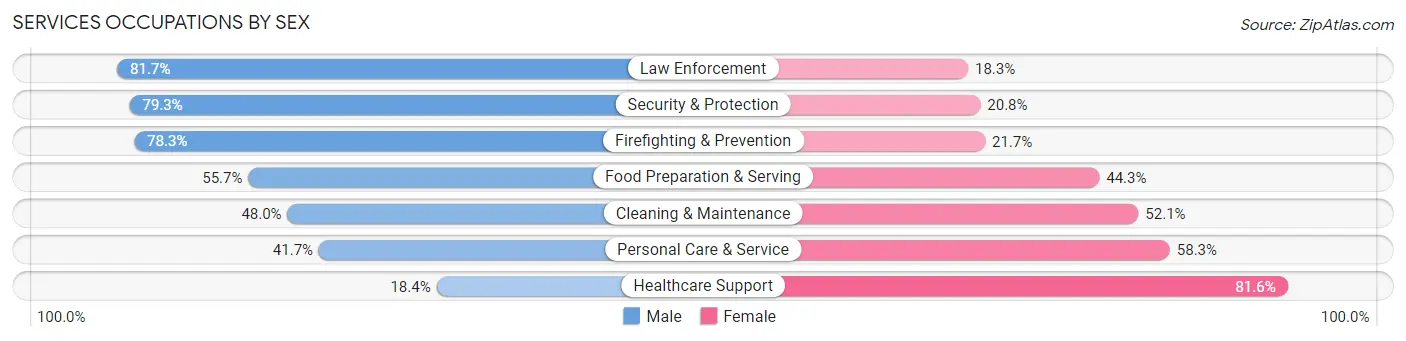
Services Occupations by Sex
Within the Services occupations in Clark County, the most male-oriented occupations are Law Enforcement (81.7%), Security & Protection (79.2%), and Firefighting & Prevention (78.3%), while the most female-oriented occupations are Healthcare Support (81.6%), Personal Care & Service (58.3%), and Cleaning & Maintenance (52.0%).
| Occupation | Male | Female |
| Healthcare Support | 4,697 (18.4%) | 20,775 (81.6%) |
| Security & Protection | 26,474 (79.2%) | 6,931 (20.7%) |
| Firefighting & Prevention | 18,937 (78.3%) | 5,242 (21.7%) |
| Law Enforcement | 7,537 (81.7%) | 1,689 (18.3%) |
| Food Preparation & Serving | 56,920 (55.7%) | 45,279 (44.3%) |
| Cleaning & Maintenance | 28,714 (47.9%) | 31,169 (52.0%) |
| Personal Care & Service | 21,181 (41.7%) | 29,588 (58.3%) |
| Total (Category) | 137,986 (50.8%) | 133,742 (49.2%) |
| Total (Overall) | 567,370 (53.7%) | 489,895 (46.3%) |
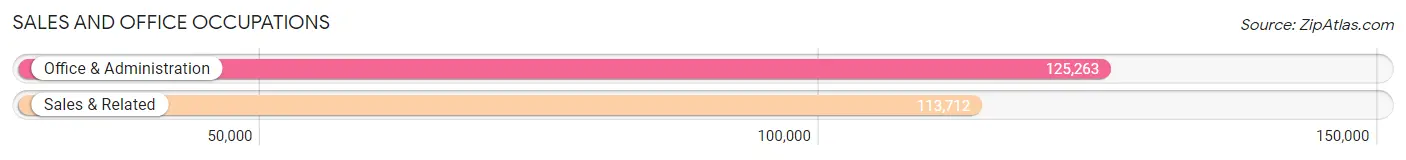
Sales and Office Occupations
The most common Sales and Office occupations in Clark County are Office & Administration (125,263 | 11.8%), and Sales & Related (113,712 | 10.8%).
Sales and Office Occupations by Sex
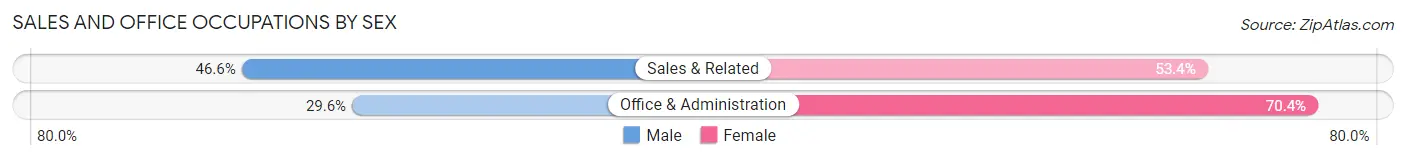
| Occupation | Male | Female |
| Sales & Related | 53,014 (46.6%) | 60,698 (53.4%) |
| Office & Administration | 37,122 (29.6%) | 88,141 (70.4%) |
| Total (Category) | 90,136 (37.7%) | 148,839 (62.3%) |
| Total (Overall) | 567,370 (53.7%) | 489,895 (46.3%) |
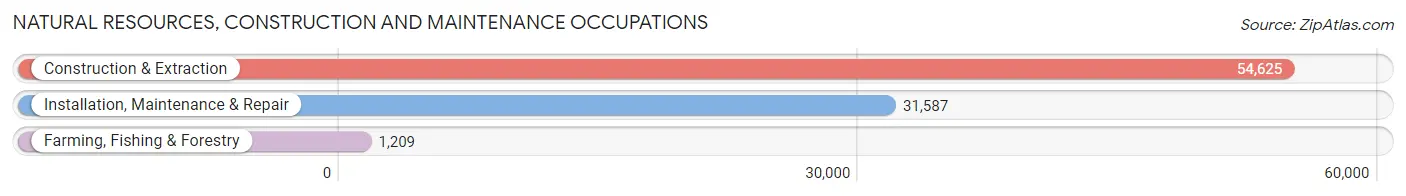
Natural Resources, Construction and Maintenance Occupations
The most common Natural Resources, Construction and Maintenance occupations in Clark County are Construction & Extraction (54,625 | 5.2%), Installation, Maintenance & Repair (31,587 | 3.0%), and Farming, Fishing & Forestry (1,209 | 0.1%).
Natural Resources, Construction and Maintenance Occupations by Sex
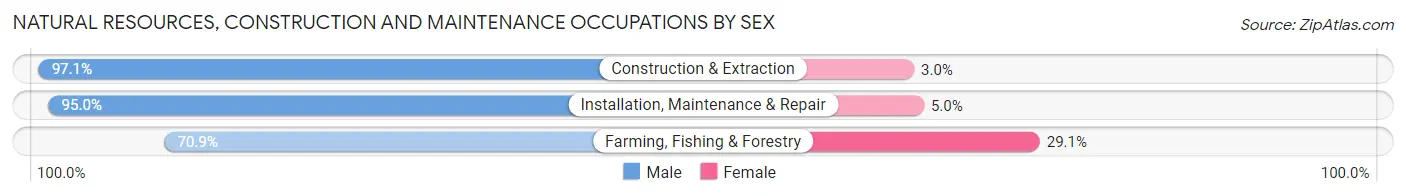
| Occupation | Male | Female |
| Farming, Fishing & Forestry | 857 (70.9%) | 352 (29.1%) |
| Construction & Extraction | 53,015 (97.1%) | 1,610 (2.9%) |
| Installation, Maintenance & Repair | 30,005 (95.0%) | 1,582 (5.0%) |
| Total (Category) | 83,877 (96.0%) | 3,544 (4.1%) |
| Total (Overall) | 567,370 (53.7%) | 489,895 (46.3%) |
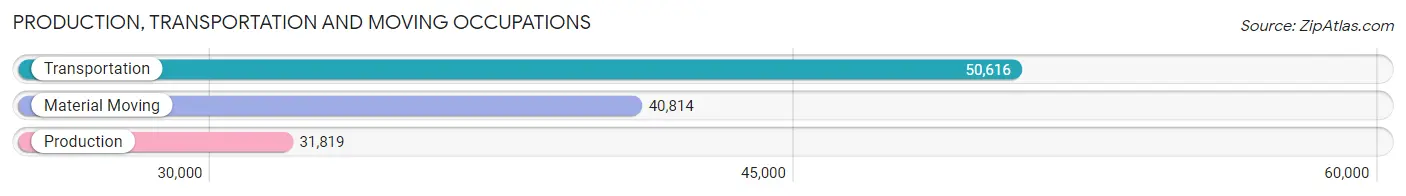
Production, Transportation and Moving Occupations
The most common Production, Transportation and Moving occupations in Clark County are Transportation (50,616 | 4.8%), Material Moving (40,814 | 3.9%), and Production (31,819 | 3.0%).
Production, Transportation and Moving Occupations by Sex
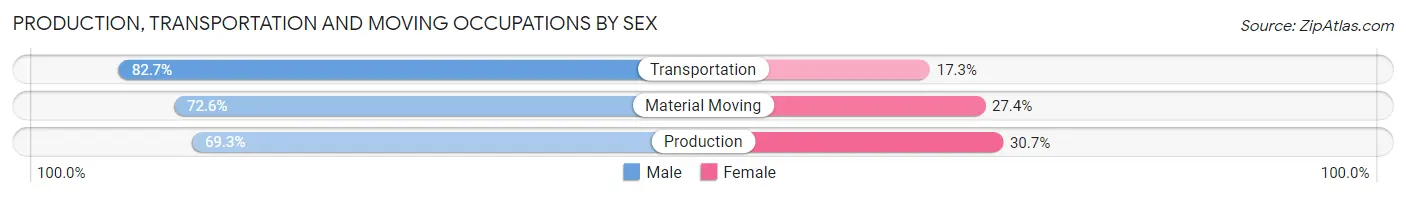
| Occupation | Male | Female |
| Production | 22,045 (69.3%) | 9,774 (30.7%) |
| Transportation | 41,858 (82.7%) | 8,758 (17.3%) |
| Material Moving | 29,617 (72.6%) | 11,197 (27.4%) |
| Total (Category) | 93,520 (75.9%) | 29,729 (24.1%) |
| Total (Overall) | 567,370 (53.7%) | 489,895 (46.3%) |
Employment Industries by Sex in Clark County
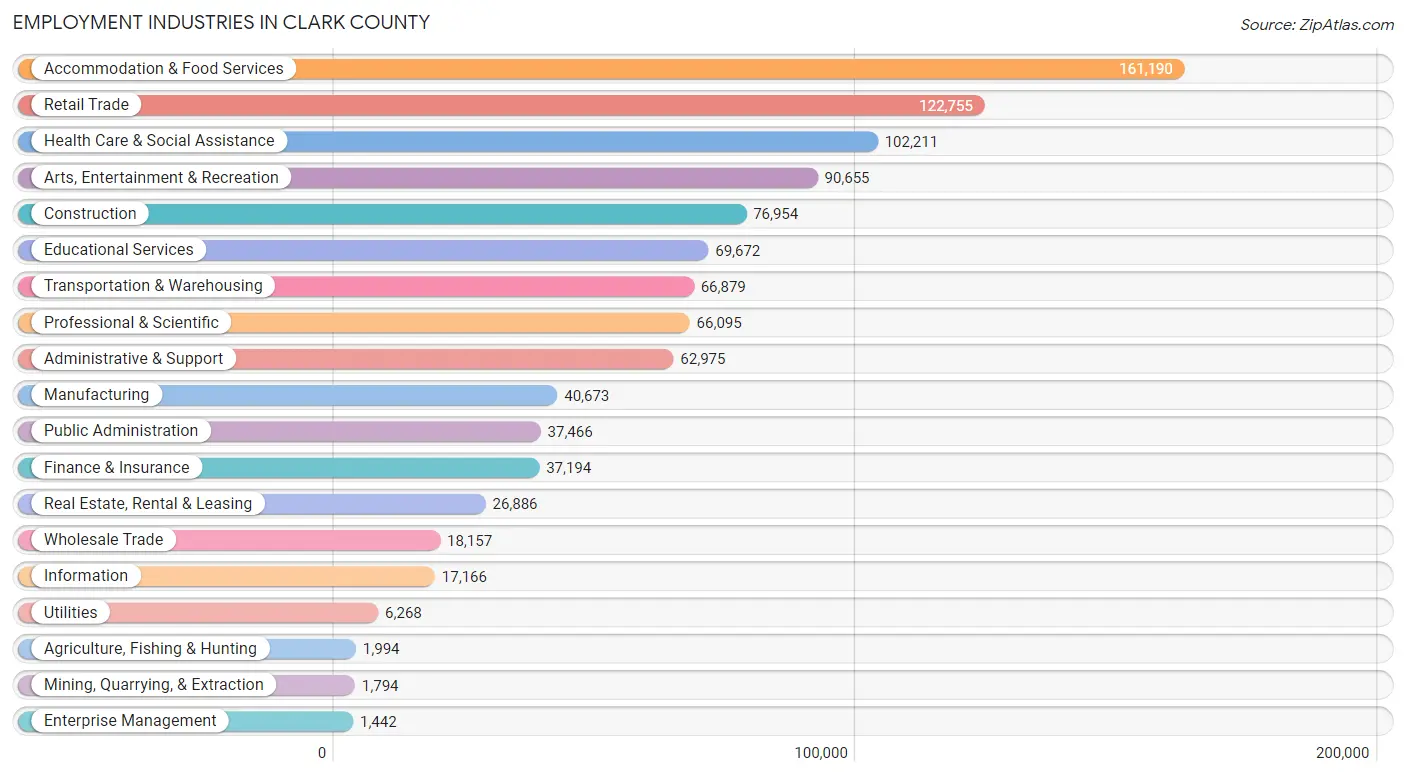
Employment Industries in Clark County
The major employment industries in Clark County include Accommodation & Food Services (161,190 | 15.2%), Retail Trade (122,755 | 11.6%), Health Care & Social Assistance (102,211 | 9.7%), Arts, Entertainment & Recreation (90,655 | 8.6%), and Construction (76,954 | 7.3%).
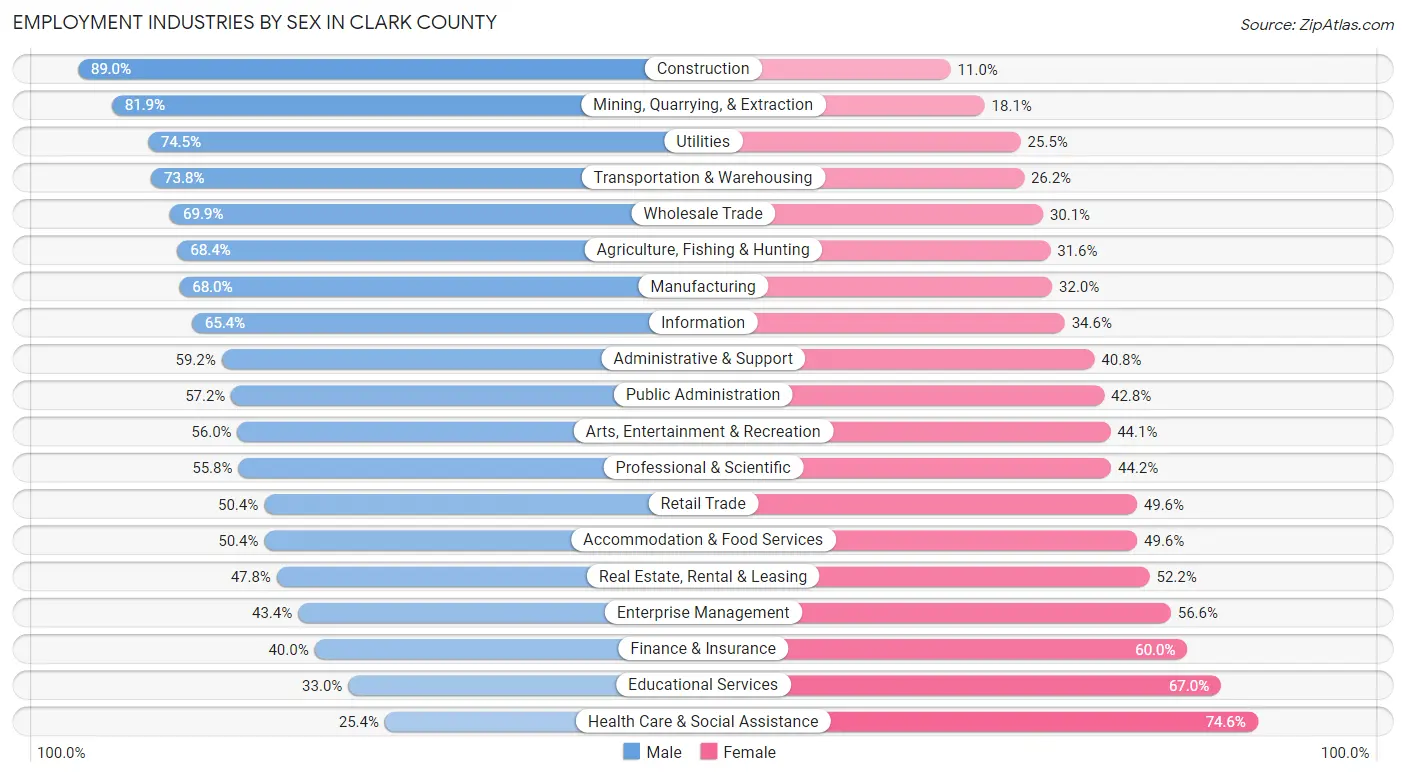
Employment Industries by Sex in Clark County
The Clark County industries that see more men than women are Construction (89.0%), Mining, Quarrying, & Extraction (81.9%), and Utilities (74.5%), whereas the industries that tend to have a higher number of women are Health Care & Social Assistance (74.6%), Educational Services (67.0%), and Finance & Insurance (60.0%).
| Industry | Male | Female |
| Agriculture, Fishing & Hunting | 1,363 (68.4%) | 631 (31.6%) |
| Mining, Quarrying, & Extraction | 1,470 (81.9%) | 324 (18.1%) |
| Construction | 68,477 (89.0%) | 8,477 (11.0%) |
| Manufacturing | 27,649 (68.0%) | 13,024 (32.0%) |
| Wholesale Trade | 12,689 (69.9%) | 5,468 (30.1%) |
| Retail Trade | 61,920 (50.4%) | 60,835 (49.6%) |
| Transportation & Warehousing | 49,364 (73.8%) | 17,515 (26.2%) |
| Utilities | 4,669 (74.5%) | 1,599 (25.5%) |
| Information | 11,222 (65.4%) | 5,944 (34.6%) |
| Finance & Insurance | 14,878 (40.0%) | 22,316 (60.0%) |
| Real Estate, Rental & Leasing | 12,857 (47.8%) | 14,029 (52.2%) |
| Professional & Scientific | 36,861 (55.8%) | 29,234 (44.2%) |
| Enterprise Management | 626 (43.4%) | 816 (56.6%) |
| Administrative & Support | 37,304 (59.2%) | 25,671 (40.8%) |
| Educational Services | 23,011 (33.0%) | 46,661 (67.0%) |
| Health Care & Social Assistance | 26,004 (25.4%) | 76,207 (74.6%) |
| Arts, Entertainment & Recreation | 50,721 (55.9%) | 39,934 (44.1%) |
| Accommodation & Food Services | 81,220 (50.4%) | 79,970 (49.6%) |
| Public Administration | 21,444 (57.2%) | 16,022 (42.8%) |
| Total | 567,370 (53.7%) | 489,895 (46.3%) |
Education in Clark County
School Enrollment in Clark County
The most common levels of schooling among the 517,893 students in Clark County are middle school (120,692 | 23.3%), high school (119,515 | 23.1%), and elementary school (108,613 | 21.0%).
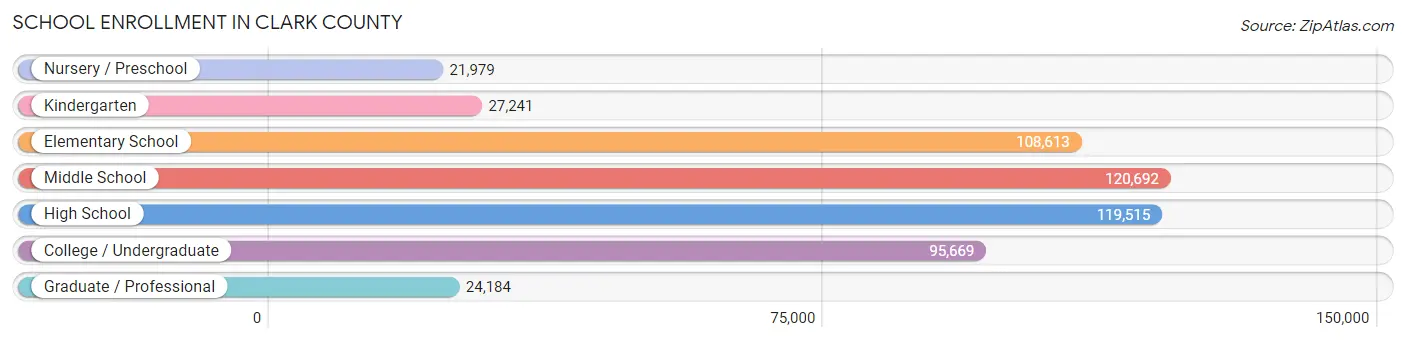
| School Level | # Students | % Students |
| Nursery / Preschool | 21,979 | 4.2% |
| Kindergarten | 27,241 | 5.3% |
| Elementary School | 108,613 | 21.0% |
| Middle School | 120,692 | 23.3% |
| High School | 119,515 | 23.1% |
| College / Undergraduate | 95,669 | 18.5% |
| Graduate / Professional | 24,184 | 4.7% |
| Total | 517,893 | 100.0% |
School Enrollment by Age by Funding Source in Clark County
Out of a total of 517,893 students who are enrolled in schools in Clark County, 67,844 (13.1%) attend a private institution, while the remaining 450,049 (86.9%) are enrolled in public schools. The age group of 3 to 4 year olds has the highest likelihood of being enrolled in private schools, with 6,735 (38.0% in the age bracket) enrolled. Conversely, the age group of 15 to 17 year olds has the lowest likelihood of being enrolled in a private school, with 78,418 (92.8% in the age bracket) attending a public institution.
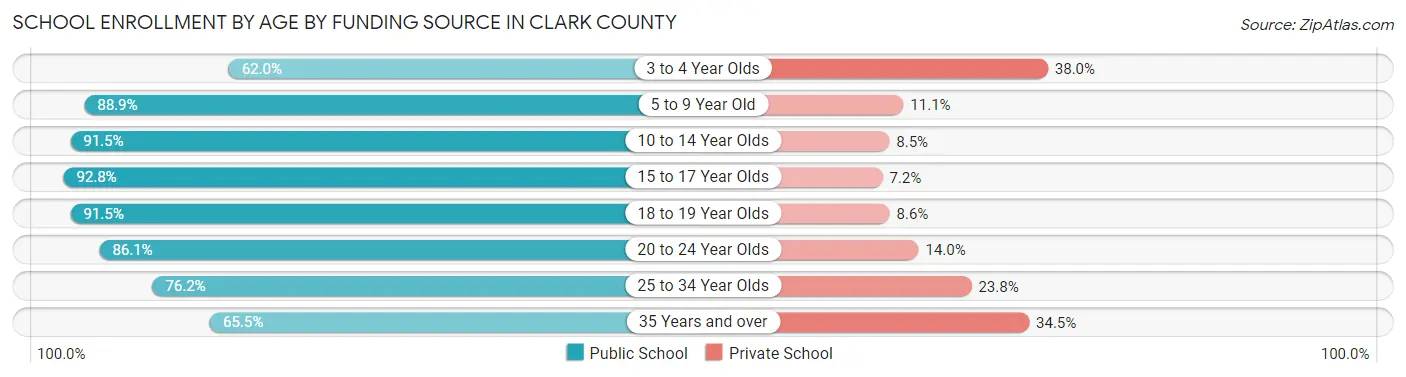
| Age Bracket | Public School | Private School |
| 3 to 4 Year Olds | 10,976 (62.0%) | 6,735 (38.0%) |
| 5 to 9 Year Old | 115,255 (88.9%) | 14,440 (11.1%) |
| 10 to 14 Year Olds | 135,693 (91.5%) | 12,622 (8.5%) |
| 15 to 17 Year Olds | 78,418 (92.8%) | 6,122 (7.2%) |
| 18 to 19 Year Olds | 27,526 (91.4%) | 2,573 (8.6%) |
| 20 to 24 Year Olds | 33,900 (86.1%) | 5,494 (14.0%) |
| 25 to 34 Year Olds | 26,716 (76.2%) | 8,347 (23.8%) |
| 35 Years and over | 21,653 (65.5%) | 11,423 (34.5%) |
| Total | 450,049 (86.9%) | 67,844 (13.1%) |
Educational Attainment by Field of Study in Clark County
Business (107,448 | 24.5%), education (47,743 | 10.9%), science & technology (45,081 | 10.3%), social sciences (33,064 | 7.5%), and arts & humanities (31,914 | 7.3%) are the most common fields of study among 438,893 individuals in Clark County who have obtained a bachelor's degree or higher.
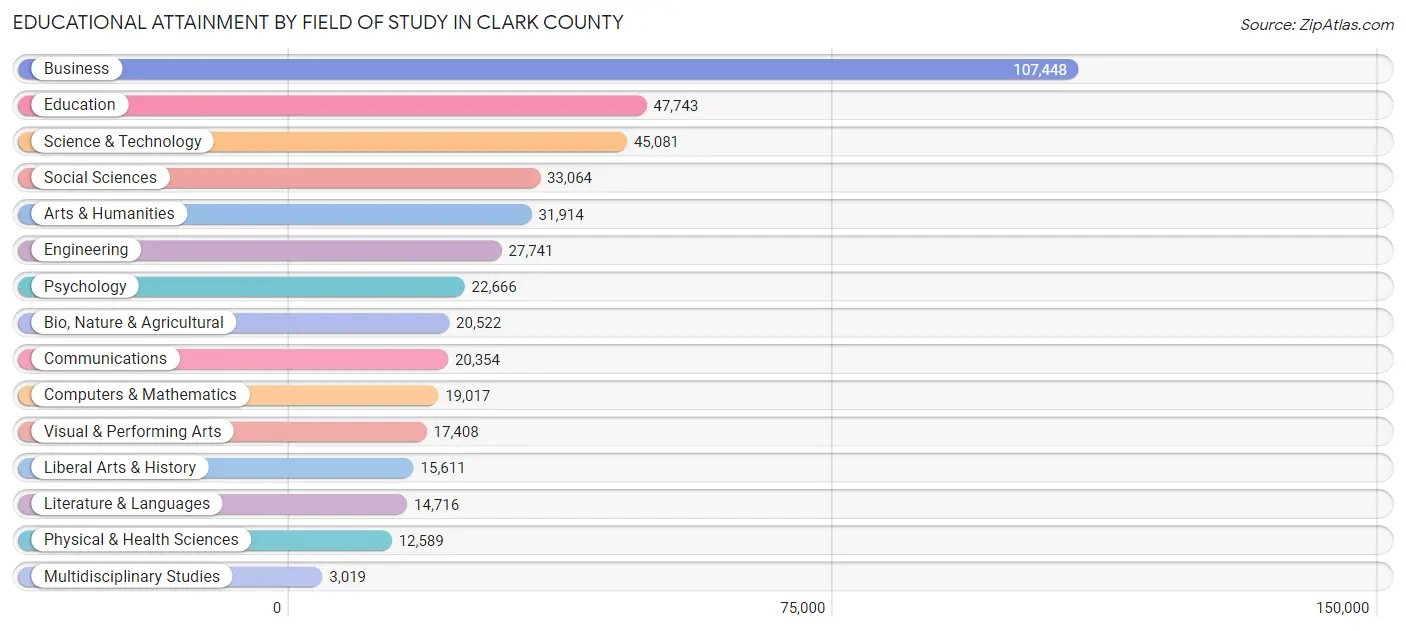
| Field of Study | # Graduates | % Graduates |
| Computers & Mathematics | 19,017 | 4.3% |
| Bio, Nature & Agricultural | 20,522 | 4.7% |
| Physical & Health Sciences | 12,589 | 2.9% |
| Psychology | 22,666 | 5.2% |
| Social Sciences | 33,064 | 7.5% |
| Engineering | 27,741 | 6.3% |
| Multidisciplinary Studies | 3,019 | 0.7% |
| Science & Technology | 45,081 | 10.3% |
| Business | 107,448 | 24.5% |
| Education | 47,743 | 10.9% |
| Literature & Languages | 14,716 | 3.4% |
| Liberal Arts & History | 15,611 | 3.6% |
| Visual & Performing Arts | 17,408 | 4.0% |
| Communications | 20,354 | 4.6% |
| Arts & Humanities | 31,914 | 7.3% |
| Total | 438,893 | 100.0% |
Transportation & Commute in Clark County
Vehicle Availability by Sex in Clark County
The most prevalent vehicle ownership categories in Clark County are males with 2 vehicles (230,372, accounting for 41.0%) and females with 2 vehicles (188,429, making up 48.3%).
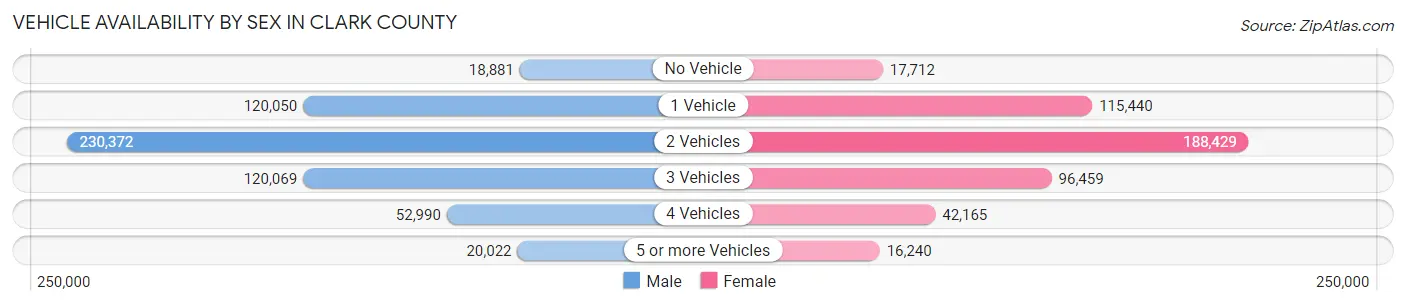
| Vehicles Available | Male | Female |
| No Vehicle | 18,881 (3.4%) | 17,712 (3.7%) |
| 1 Vehicle | 120,050 (21.3%) | 115,440 (24.2%) |
| 2 Vehicles | 230,372 (41.0%) | 188,429 (39.6%) |
| 3 Vehicles | 120,069 (21.3%) | 96,459 (20.3%) |
| 4 Vehicles | 52,990 (9.4%) | 42,165 (8.8%) |
| 5 or more Vehicles | 20,022 (3.6%) | 16,240 (3.4%) |
| Total | 562,384 (100.0%) | 476,445 (100.0%) |
Commute Time in Clark County
The most frequently occuring commute durations in Clark County are 20 to 24 minutes (184,991 commuters, 19.6%), 30 to 34 minutes (177,433 commuters, 18.8%), and 15 to 19 minutes (149,809 commuters, 15.9%).
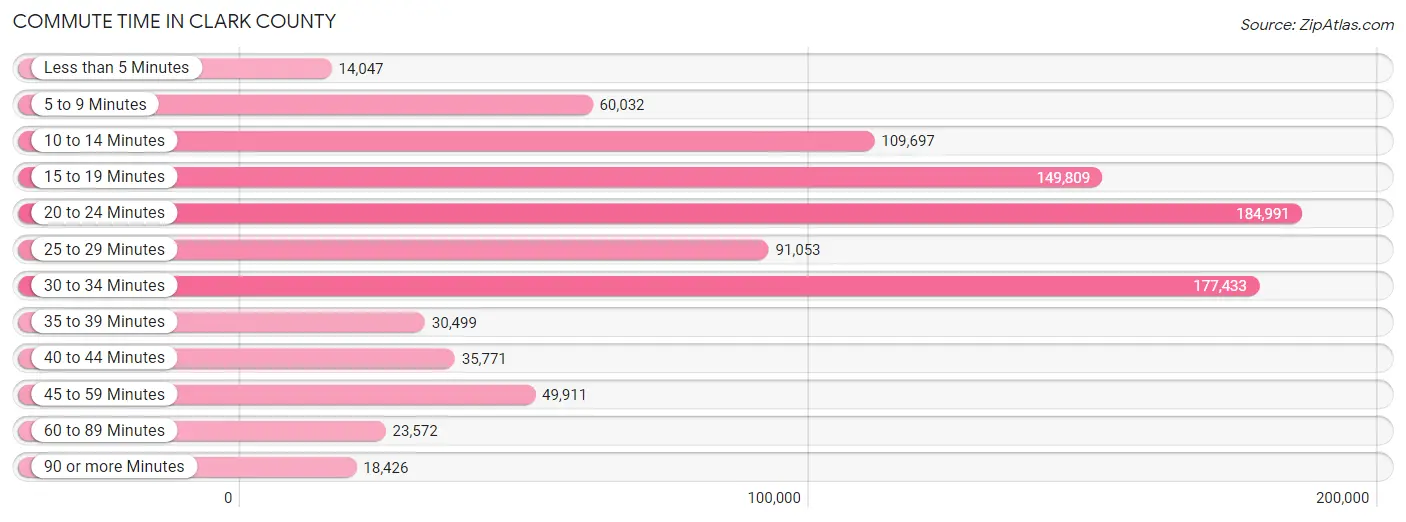
| Commute Time | # Commuters | % Commuters |
| Less than 5 Minutes | 14,047 | 1.5% |
| 5 to 9 Minutes | 60,032 | 6.4% |
| 10 to 14 Minutes | 109,697 | 11.6% |
| 15 to 19 Minutes | 149,809 | 15.9% |
| 20 to 24 Minutes | 184,991 | 19.6% |
| 25 to 29 Minutes | 91,053 | 9.6% |
| 30 to 34 Minutes | 177,433 | 18.8% |
| 35 to 39 Minutes | 30,499 | 3.2% |
| 40 to 44 Minutes | 35,771 | 3.8% |
| 45 to 59 Minutes | 49,911 | 5.3% |
| 60 to 89 Minutes | 23,572 | 2.5% |
| 90 or more Minutes | 18,426 | 1.9% |
Commute Time by Sex in Clark County
The most common commute times in Clark County are 30 to 34 minutes (102,532 commuters, 19.8%) for males and 20 to 24 minutes (84,692 commuters, 19.8%) for females.
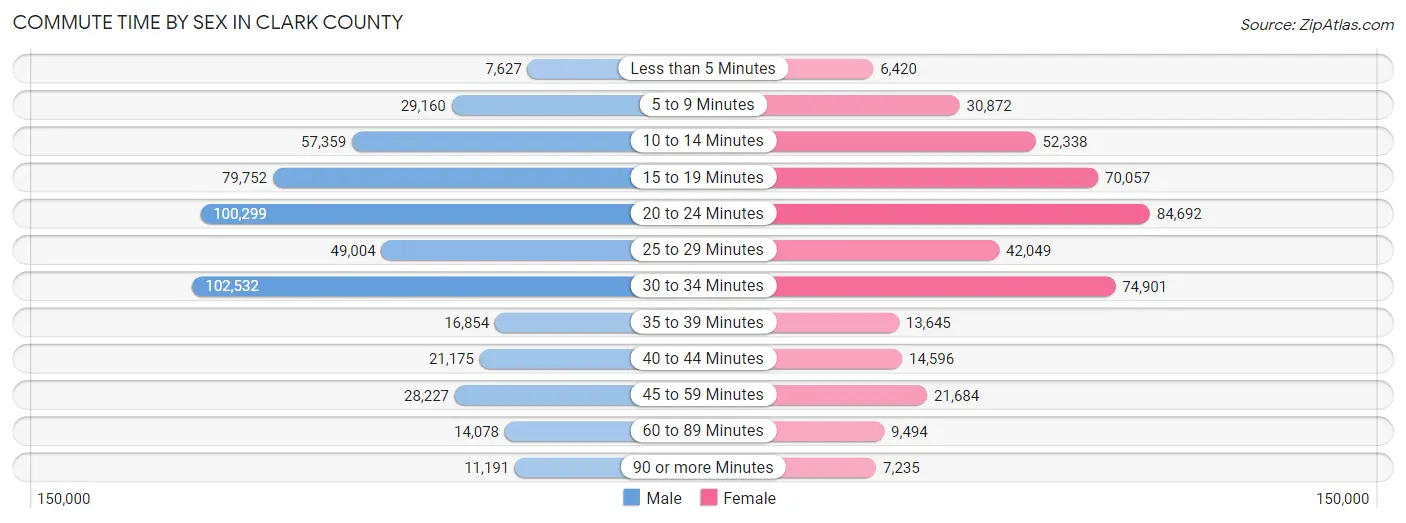
| Commute Time | Male | Female |
| Less than 5 Minutes | 7,627 (1.5%) | 6,420 (1.5%) |
| 5 to 9 Minutes | 29,160 (5.6%) | 30,872 (7.2%) |
| 10 to 14 Minutes | 57,359 (11.1%) | 52,338 (12.2%) |
| 15 to 19 Minutes | 79,752 (15.4%) | 70,057 (16.4%) |
| 20 to 24 Minutes | 100,299 (19.4%) | 84,692 (19.8%) |
| 25 to 29 Minutes | 49,004 (9.5%) | 42,049 (9.8%) |
| 30 to 34 Minutes | 102,532 (19.8%) | 74,901 (17.5%) |
| 35 to 39 Minutes | 16,854 (3.3%) | 13,645 (3.2%) |
| 40 to 44 Minutes | 21,175 (4.1%) | 14,596 (3.4%) |
| 45 to 59 Minutes | 28,227 (5.5%) | 21,684 (5.1%) |
| 60 to 89 Minutes | 14,078 (2.7%) | 9,494 (2.2%) |
| 90 or more Minutes | 11,191 (2.2%) | 7,235 (1.7%) |
Time of Departure to Work by Sex in Clark County
The most frequent times of departure to work in Clark County are 7:00 AM to 7:29 AM (54,317, 10.5%) for males and 7:00 AM to 7:29 AM (53,638, 12.5%) for females.
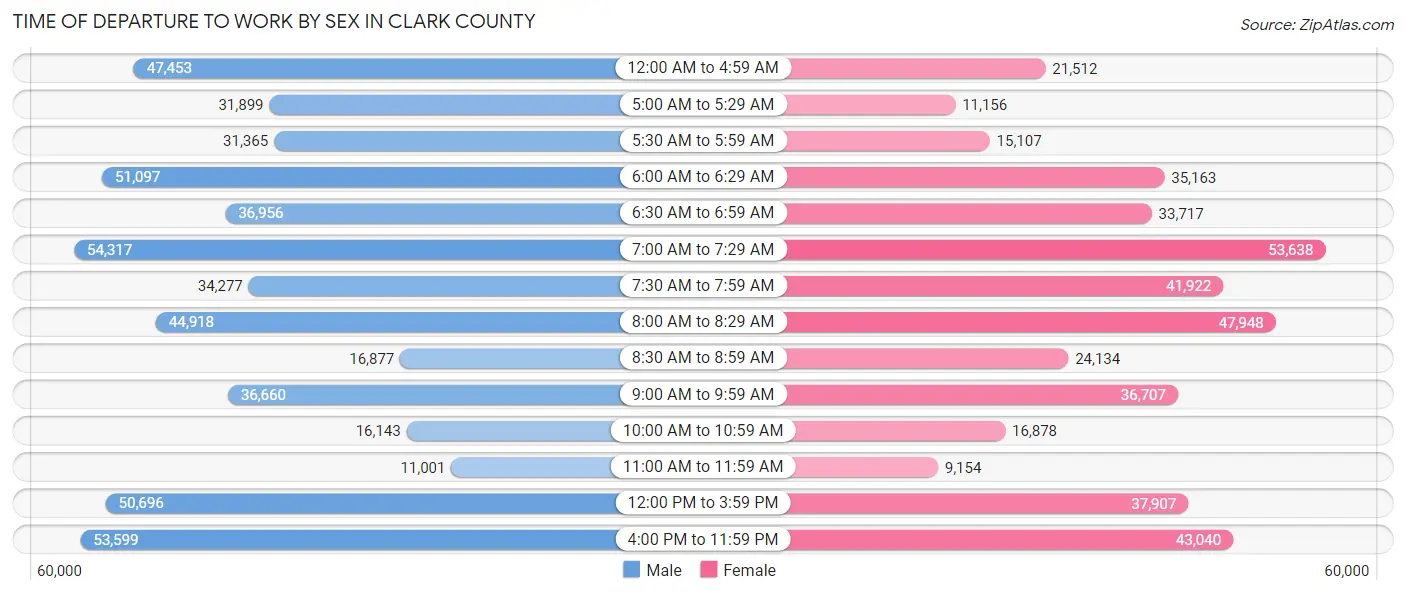
| Time of Departure | Male | Female |
| 12:00 AM to 4:59 AM | 47,453 (9.2%) | 21,512 (5.0%) |
| 5:00 AM to 5:29 AM | 31,899 (6.2%) | 11,156 (2.6%) |
| 5:30 AM to 5:59 AM | 31,365 (6.1%) | 15,107 (3.5%) |
| 6:00 AM to 6:29 AM | 51,097 (9.9%) | 35,163 (8.2%) |
| 6:30 AM to 6:59 AM | 36,956 (7.1%) | 33,717 (7.9%) |
| 7:00 AM to 7:29 AM | 54,317 (10.5%) | 53,638 (12.5%) |
| 7:30 AM to 7:59 AM | 34,277 (6.6%) | 41,922 (9.8%) |
| 8:00 AM to 8:29 AM | 44,918 (8.7%) | 47,948 (11.2%) |
| 8:30 AM to 8:59 AM | 16,877 (3.3%) | 24,134 (5.6%) |
| 9:00 AM to 9:59 AM | 36,660 (7.1%) | 36,707 (8.6%) |
| 10:00 AM to 10:59 AM | 16,143 (3.1%) | 16,878 (3.9%) |
| 11:00 AM to 11:59 AM | 11,001 (2.1%) | 9,154 (2.1%) |
| 12:00 PM to 3:59 PM | 50,696 (9.8%) | 37,907 (8.9%) |
| 4:00 PM to 11:59 PM | 53,599 (10.4%) | 43,040 (10.1%) |
| Total | 517,258 (100.0%) | 427,983 (100.0%) |
Housing Occupancy in Clark County
Occupancy by Ownership in Clark County
Of the total 832,367 dwellings in Clark County, owner-occupied units account for 467,708 (56.2%), while renter-occupied units make up 364,659 (43.8%).
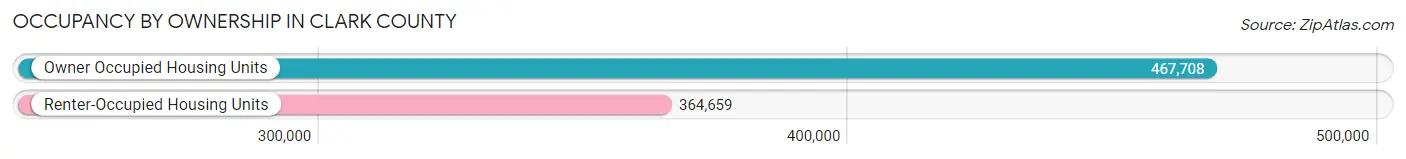
| Occupancy | # Housing Units | % Housing Units |
| Owner Occupied Housing Units | 467,708 | 56.2% |
| Renter-Occupied Housing Units | 364,659 | 43.8% |
| Total Occupied Housing Units | 832,367 | 100.0% |
Occupancy by Household Size in Clark County
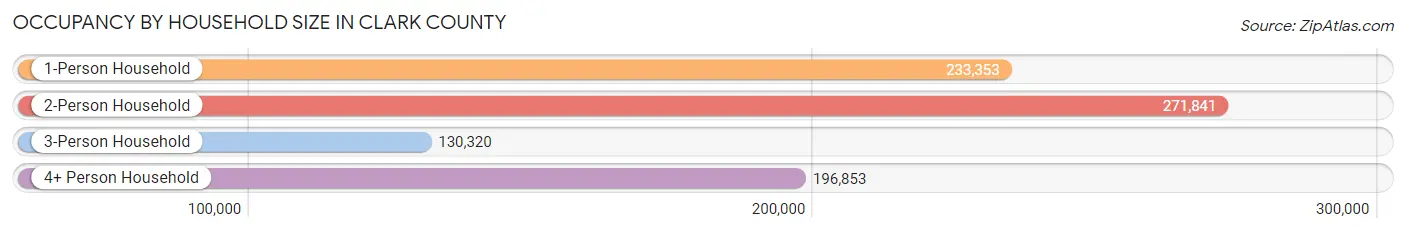
| Household Size | # Housing Units | % Housing Units |
| 1-Person Household | 233,353 | 28.0% |
| 2-Person Household | 271,841 | 32.7% |
| 3-Person Household | 130,320 | 15.7% |
| 4+ Person Household | 196,853 | 23.6% |
| Total Housing Units | 832,367 | 100.0% |
Occupancy by Ownership by Household Size in Clark County
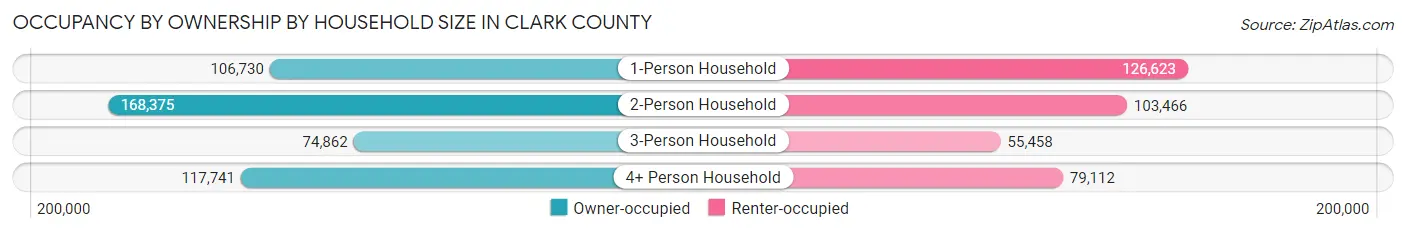
| Household Size | Owner-occupied | Renter-occupied |
| 1-Person Household | 106,730 (45.7%) | 126,623 (54.3%) |
| 2-Person Household | 168,375 (61.9%) | 103,466 (38.1%) |
| 3-Person Household | 74,862 (57.4%) | 55,458 (42.6%) |
| 4+ Person Household | 117,741 (59.8%) | 79,112 (40.2%) |
| Total Housing Units | 467,708 (56.2%) | 364,659 (43.8%) |
Occupancy by Educational Attainment in Clark County
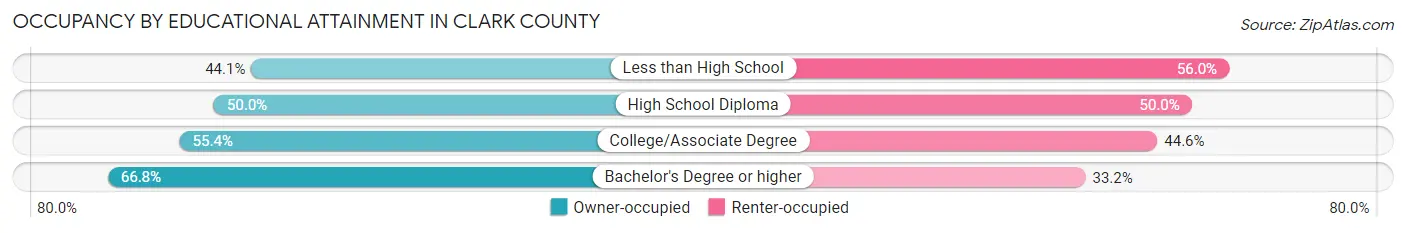
| Household Size | Owner-occupied | Renter-occupied |
| Less than High School | 40,777 (44.1%) | 51,788 (55.9%) |
| High School Diploma | 100,809 (50.0%) | 100,920 (50.0%) |
| College/Associate Degree | 161,705 (55.4%) | 130,180 (44.6%) |
| Bachelor's Degree or higher | 164,417 (66.8%) | 81,771 (33.2%) |
Occupancy by Age of Householder in Clark County
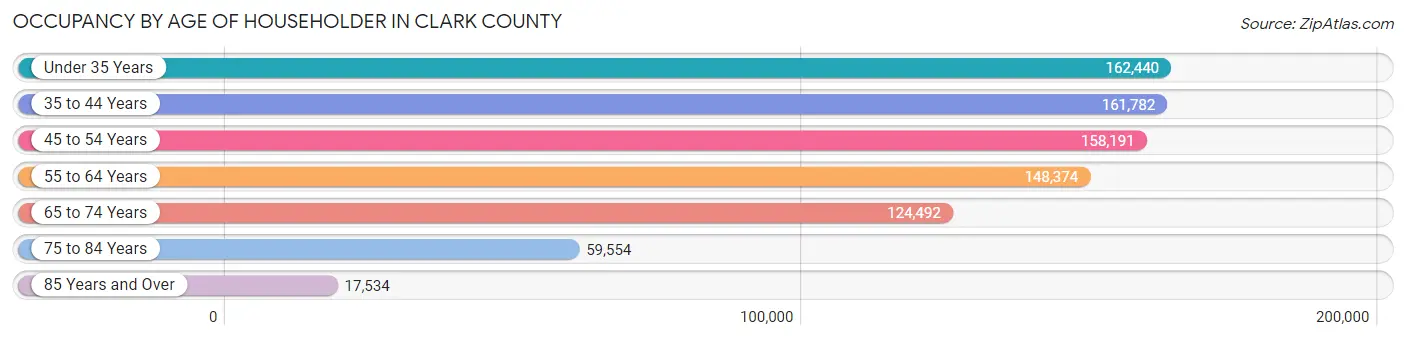
| Age Bracket | # Households | % Households |
| Under 35 Years | 162,440 | 19.5% |
| 35 to 44 Years | 161,782 | 19.4% |
| 45 to 54 Years | 158,191 | 19.0% |
| 55 to 64 Years | 148,374 | 17.8% |
| 65 to 74 Years | 124,492 | 15.0% |
| 75 to 84 Years | 59,554 | 7.1% |
| 85 Years and Over | 17,534 | 2.1% |
| Total | 832,367 | 100.0% |
Housing Finances in Clark County
Median Income by Occupancy in Clark County
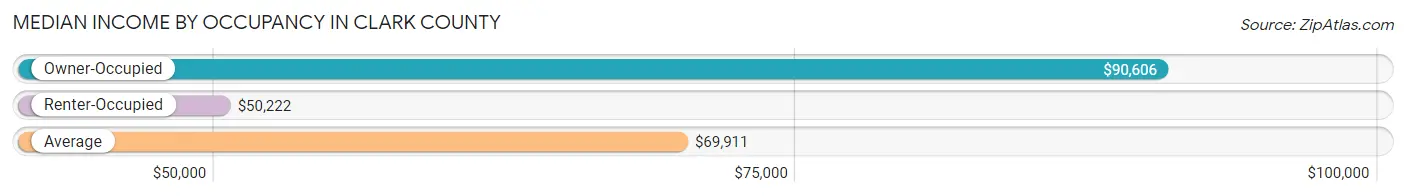
| Occupancy Type | # Households | Median Income |
| Owner-Occupied | 467,708 (56.2%) | $90,606 |
| Renter-Occupied | 364,659 (43.8%) | $50,222 |
| Average | 832,367 (100.0%) | $69,911 |
Occupancy by Householder Income Bracket in Clark County
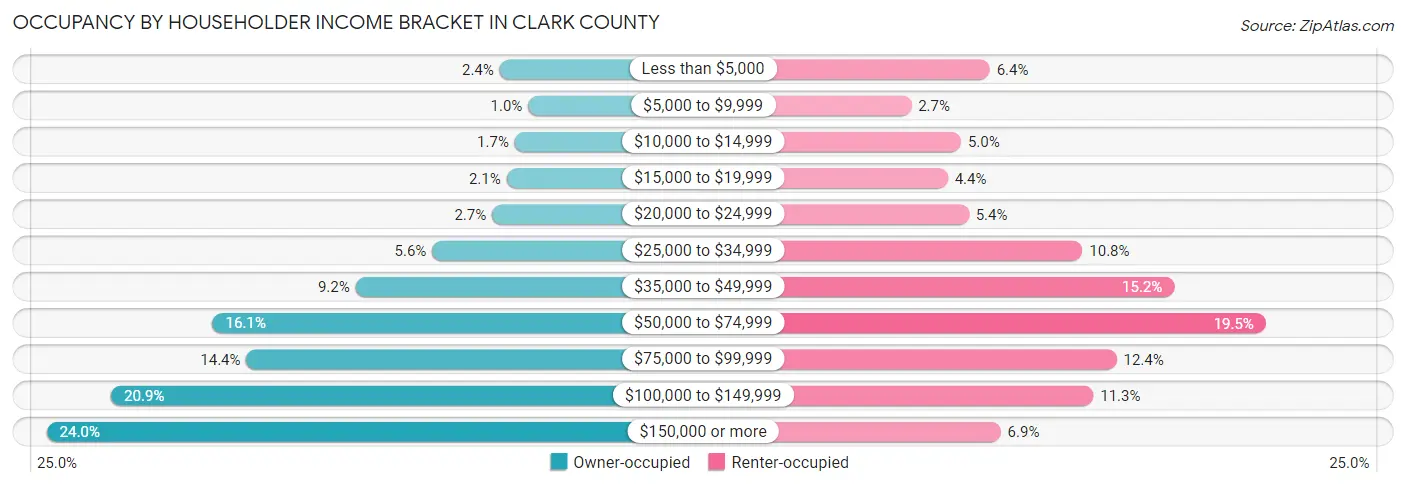
| Income Bracket | Owner-occupied | Renter-occupied |
| Less than $5,000 | 11,115 (2.4%) | 23,286 (6.4%) |
| $5,000 to $9,999 | 4,763 (1.0%) | 9,653 (2.6%) |
| $10,000 to $14,999 | 7,757 (1.7%) | 18,322 (5.0%) |
| $15,000 to $19,999 | 9,576 (2.1%) | 16,020 (4.4%) |
| $20,000 to $24,999 | 12,802 (2.7%) | 19,649 (5.4%) |
| $25,000 to $34,999 | 26,166 (5.6%) | 39,379 (10.8%) |
| $35,000 to $49,999 | 43,233 (9.2%) | 55,314 (15.2%) |
| $50,000 to $74,999 | 75,063 (16.1%) | 71,227 (19.5%) |
| $75,000 to $99,999 | 67,520 (14.4%) | 45,327 (12.4%) |
| $100,000 to $149,999 | 97,679 (20.9%) | 41,288 (11.3%) |
| $150,000 or more | 112,034 (23.9%) | 25,194 (6.9%) |
| Total | 467,708 (100.0%) | 364,659 (100.0%) |
Monthly Housing Cost Tiers in Clark County
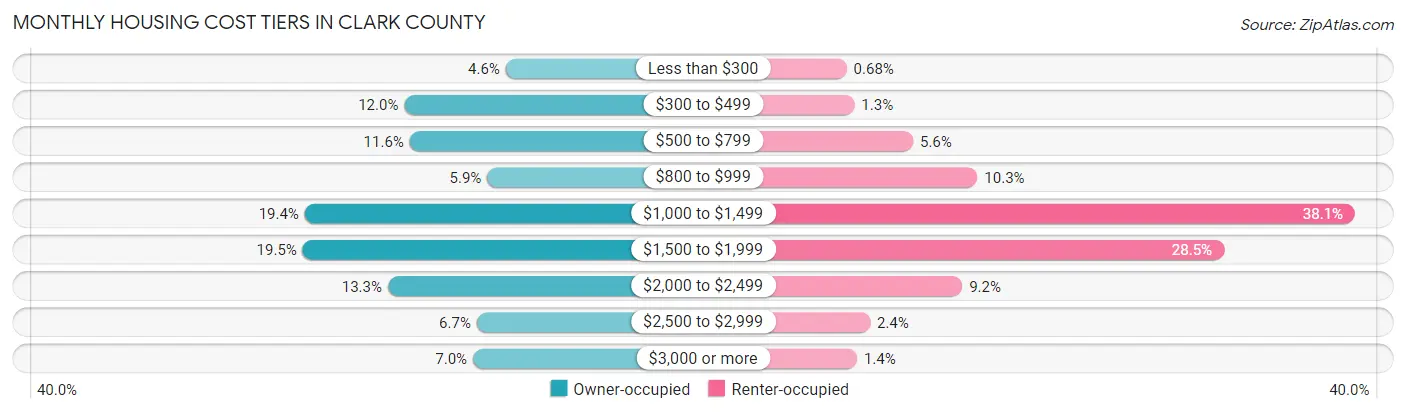
| Monthly Cost | Owner-occupied | Renter-occupied |
| Less than $300 | 21,352 (4.6%) | 2,486 (0.7%) |
| $300 to $499 | 56,318 (12.0%) | 4,548 (1.3%) |
| $500 to $799 | 54,434 (11.6%) | 20,322 (5.6%) |
| $800 to $999 | 27,737 (5.9%) | 37,581 (10.3%) |
| $1,000 to $1,499 | 90,585 (19.4%) | 138,954 (38.1%) |
| $1,500 to $1,999 | 91,312 (19.5%) | 103,783 (28.5%) |
| $2,000 to $2,499 | 61,994 (13.3%) | 33,525 (9.2%) |
| $2,500 to $2,999 | 31,338 (6.7%) | 8,739 (2.4%) |
| $3,000 or more | 32,638 (7.0%) | 5,252 (1.4%) |
| Total | 467,708 (100.0%) | 364,659 (100.0%) |
Physical Housing Characteristics in Clark County
Housing Structures in Clark County
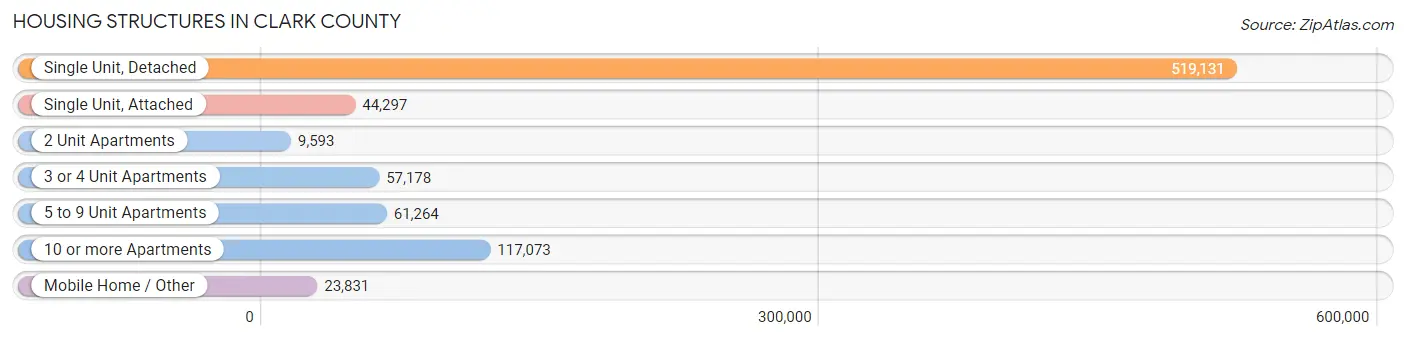
| Structure Type | # Housing Units | % Housing Units |
| Single Unit, Detached | 519,131 | 62.4% |
| Single Unit, Attached | 44,297 | 5.3% |
| 2 Unit Apartments | 9,593 | 1.1% |
| 3 or 4 Unit Apartments | 57,178 | 6.9% |
| 5 to 9 Unit Apartments | 61,264 | 7.4% |
| 10 or more Apartments | 117,073 | 14.1% |
| Mobile Home / Other | 23,831 | 2.9% |
| Total | 832,367 | 100.0% |
Housing Structures by Occupancy in Clark County
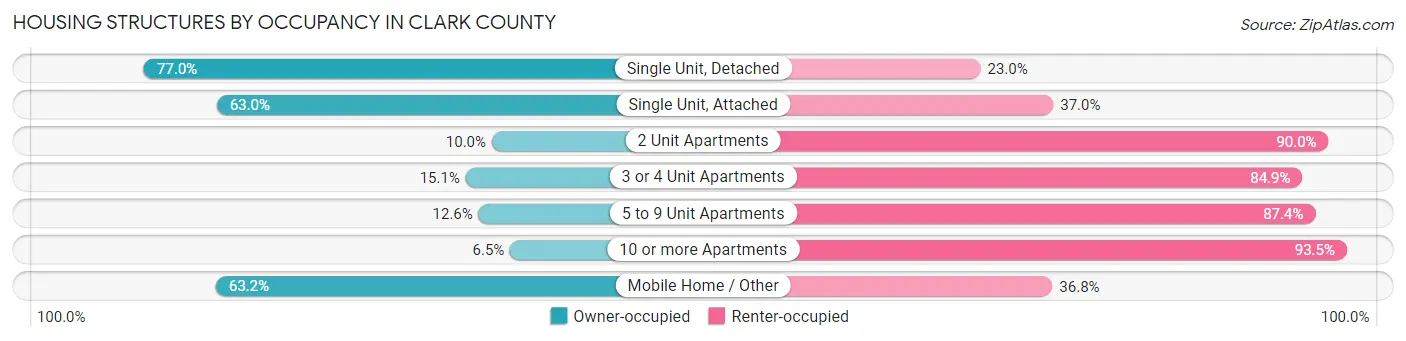
| Structure Type | Owner-occupied | Renter-occupied |
| Single Unit, Detached | 399,832 (77.0%) | 119,299 (23.0%) |
| Single Unit, Attached | 27,912 (63.0%) | 16,385 (37.0%) |
| 2 Unit Apartments | 963 (10.0%) | 8,630 (90.0%) |
| 3 or 4 Unit Apartments | 8,615 (15.1%) | 48,563 (84.9%) |
| 5 to 9 Unit Apartments | 7,707 (12.6%) | 53,557 (87.4%) |
| 10 or more Apartments | 7,623 (6.5%) | 109,450 (93.5%) |
| Mobile Home / Other | 15,056 (63.2%) | 8,775 (36.8%) |
| Total | 467,708 (56.2%) | 364,659 (43.8%) |
Housing Structures by Number of Rooms in Clark County
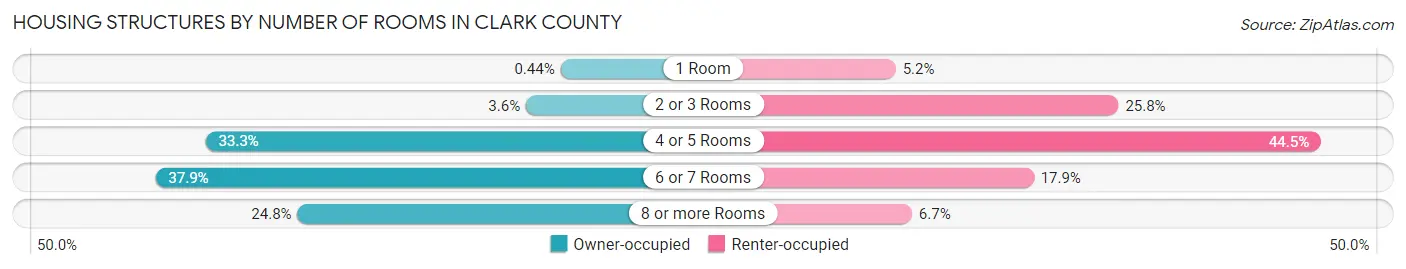
| Number of Rooms | Owner-occupied | Renter-occupied |
| 1 Room | 2,040 (0.4%) | 18,814 (5.2%) |
| 2 or 3 Rooms | 16,956 (3.6%) | 93,945 (25.8%) |
| 4 or 5 Rooms | 155,598 (33.3%) | 162,248 (44.5%) |
| 6 or 7 Rooms | 177,263 (37.9%) | 65,348 (17.9%) |
| 8 or more Rooms | 115,851 (24.8%) | 24,304 (6.7%) |
| Total | 467,708 (100.0%) | 364,659 (100.0%) |
Housing Structure by Heating Type in Clark County
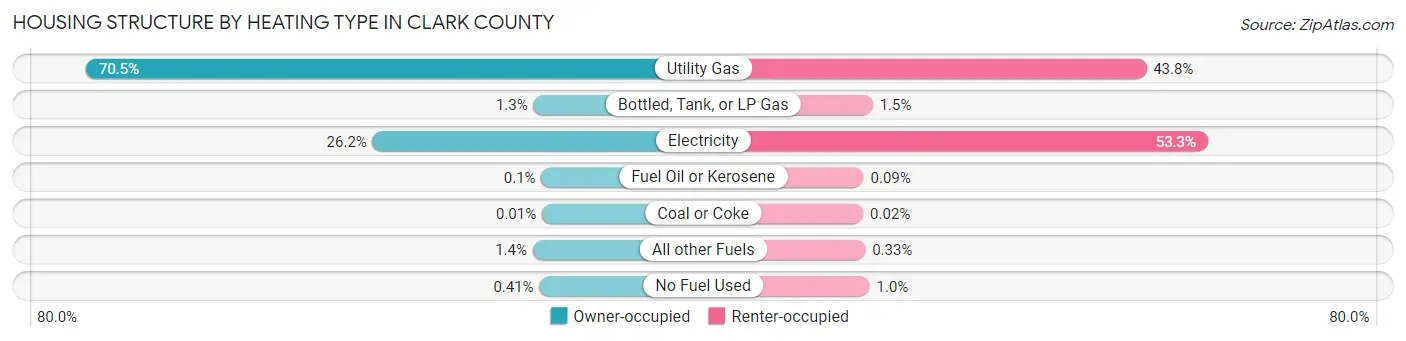
| Heating Type | Owner-occupied | Renter-occupied |
| Utility Gas | 329,866 (70.5%) | 159,594 (43.8%) |
| Bottled, Tank, or LP Gas | 6,162 (1.3%) | 5,459 (1.5%) |
| Electricity | 122,477 (26.2%) | 194,314 (53.3%) |
| Fuel Oil or Kerosene | 486 (0.1%) | 313 (0.1%) |
| Coal or Coke | 61 (0.0%) | 83 (0.0%) |
| All other Fuels | 6,755 (1.4%) | 1,205 (0.3%) |
| No Fuel Used | 1,901 (0.4%) | 3,691 (1.0%) |
| Total | 467,708 (100.0%) | 364,659 (100.0%) |
Household Vehicle Usage in Clark County
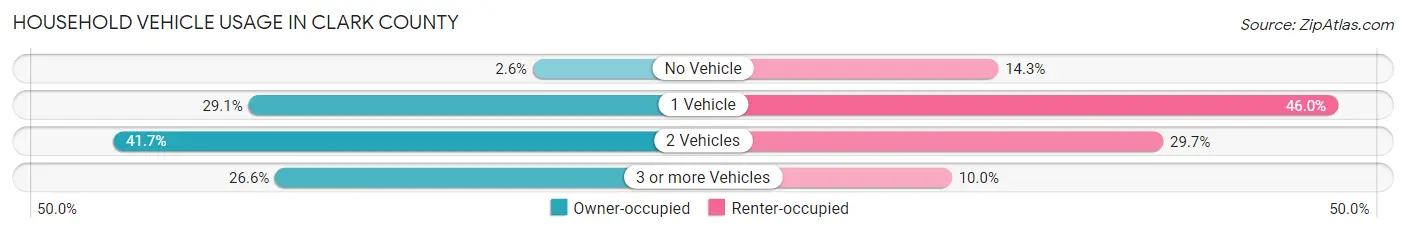
| Vehicles per Household | Owner-occupied | Renter-occupied |
| No Vehicle | 11,919 (2.5%) | 52,167 (14.3%) |
| 1 Vehicle | 136,122 (29.1%) | 167,818 (46.0%) |
| 2 Vehicles | 195,220 (41.7%) | 108,305 (29.7%) |
| 3 or more Vehicles | 124,447 (26.6%) | 36,369 (10.0%) |
| Total | 467,708 (100.0%) | 364,659 (100.0%) |
Real Estate & Mortgages in Clark County
Real Estate and Mortgage Overview in Clark County
| Characteristic | Without Mortgage | With Mortgage |
| Housing Units | 146,024 | 321,684 |
| Median Property Value | $345,200 | $376,900 |
| Median Household Income | $70,057 | $85,883 |
| Monthly Housing Costs | $493 | $31,784 |
| Real Estate Taxes | $1,789 | $10,998 |
Property Value by Mortgage Status in Clark County
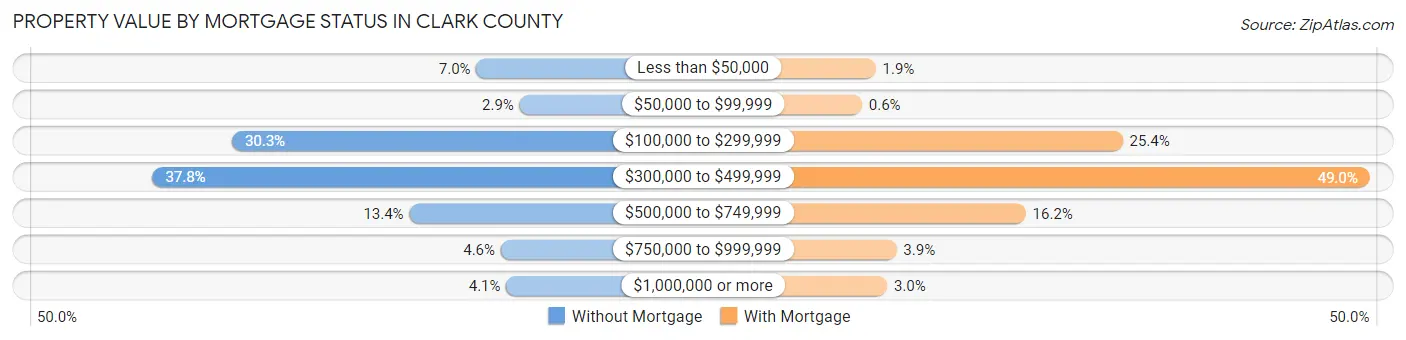
| Property Value | Without Mortgage | With Mortgage |
| Less than $50,000 | 10,178 (7.0%) | 6,153 (1.9%) |
| $50,000 to $99,999 | 4,165 (2.9%) | 1,915 (0.6%) |
| $100,000 to $299,999 | 44,165 (30.2%) | 81,800 (25.4%) |
| $300,000 to $499,999 | 55,221 (37.8%) | 157,514 (49.0%) |
| $500,000 to $749,999 | 19,500 (13.4%) | 52,113 (16.2%) |
| $750,000 to $999,999 | 6,775 (4.6%) | 12,523 (3.9%) |
| $1,000,000 or more | 6,020 (4.1%) | 9,666 (3.0%) |
| Total | 146,024 (100.0%) | 321,684 (100.0%) |
Household Income by Mortgage Status in Clark County
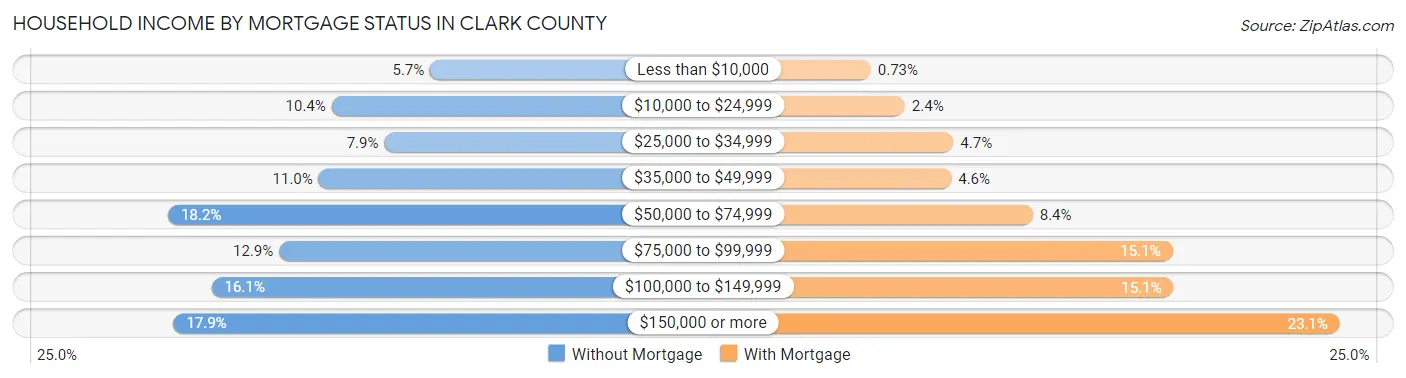
| Household Income | Without Mortgage | With Mortgage |
| Less than $10,000 | 8,306 (5.7%) | 2,336 (0.7%) |
| $10,000 to $24,999 | 15,152 (10.4%) | 7,572 (2.4%) |
| $25,000 to $34,999 | 11,493 (7.9%) | 14,983 (4.7%) |
| $35,000 to $49,999 | 16,067 (11.0%) | 14,673 (4.6%) |
| $50,000 to $74,999 | 26,533 (18.2%) | 27,166 (8.4%) |
| $75,000 to $99,999 | 18,810 (12.9%) | 48,530 (15.1%) |
| $100,000 to $149,999 | 23,512 (16.1%) | 48,710 (15.1%) |
| $150,000 or more | 26,151 (17.9%) | 74,167 (23.1%) |
| Total | 146,024 (100.0%) | 321,684 (100.0%) |
Property Value to Household Income Ratio in Clark County
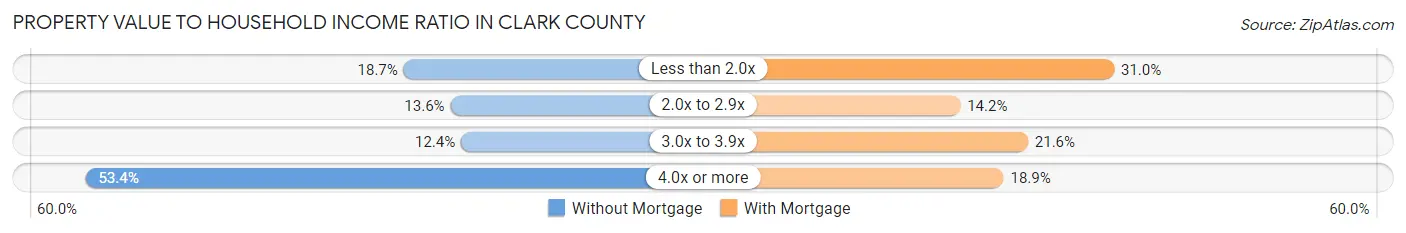
| Value-to-Income Ratio | Without Mortgage | With Mortgage |
| Less than 2.0x | 27,310 (18.7%) | 99,584 (31.0%) |
| 2.0x to 2.9x | 19,861 (13.6%) | 45,671 (14.2%) |
| 3.0x to 3.9x | 18,172 (12.4%) | 69,383 (21.6%) |
| 4.0x or more | 77,920 (53.4%) | 60,852 (18.9%) |
| Total | 146,024 (100.0%) | 321,684 (100.0%) |
Real Estate Taxes by Mortgage Status in Clark County
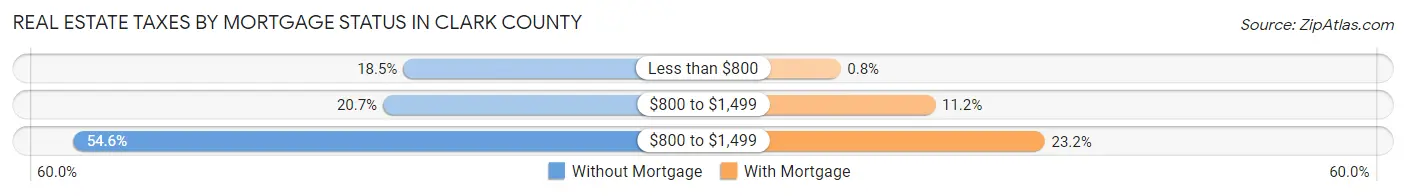
| Property Taxes | Without Mortgage | With Mortgage |
| Less than $800 | 27,030 (18.5%) | 2,558 (0.8%) |
| $800 to $1,499 | 30,275 (20.7%) | 35,969 (11.2%) |
| $800 to $1,499 | 79,740 (54.6%) | 74,574 (23.2%) |
| Total | 146,024 (100.0%) | 321,684 (100.0%) |
Health & Disability in Clark County
Health Insurance Coverage by Age in Clark County
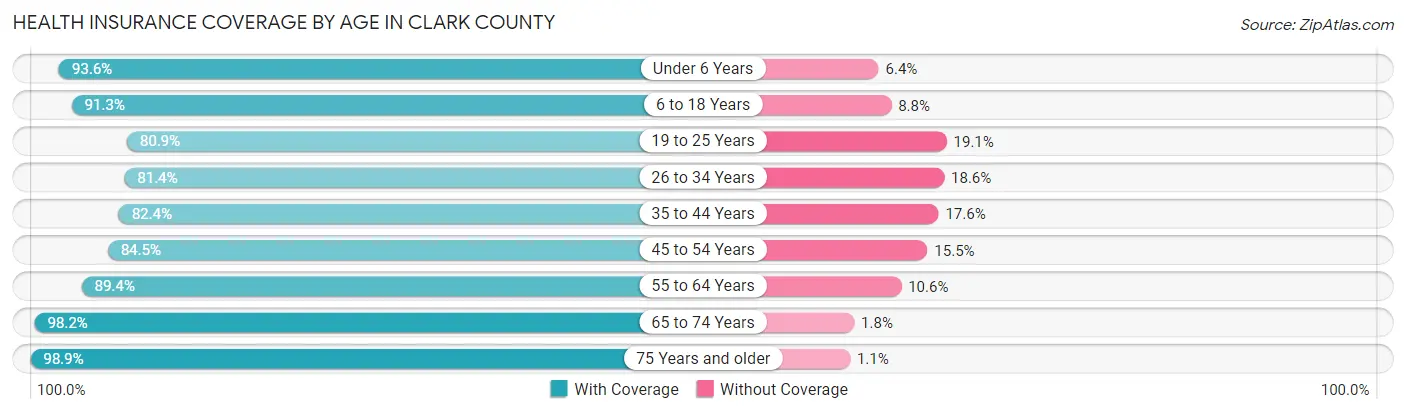
| Age Bracket | With Coverage | Without Coverage |
| Under 6 Years | 150,809 (93.6%) | 10,319 (6.4%) |
| 6 to 18 Years | 346,885 (91.2%) | 33,280 (8.7%) |
| 19 to 25 Years | 155,009 (80.9%) | 36,556 (19.1%) |
| 26 to 34 Years | 238,547 (81.4%) | 54,560 (18.6%) |
| 35 to 44 Years | 256,648 (82.4%) | 54,673 (17.6%) |
| 45 to 54 Years | 248,637 (84.5%) | 45,624 (15.5%) |
| 55 to 64 Years | 239,870 (89.4%) | 28,505 (10.6%) |
| 65 to 74 Years | 205,140 (98.2%) | 3,846 (1.8%) |
| 75 Years and older | 130,833 (98.9%) | 1,398 (1.1%) |
| Total | 1,972,378 (88.0%) | 268,761 (12.0%) |
Health Insurance Coverage by Citizenship Status in Clark County
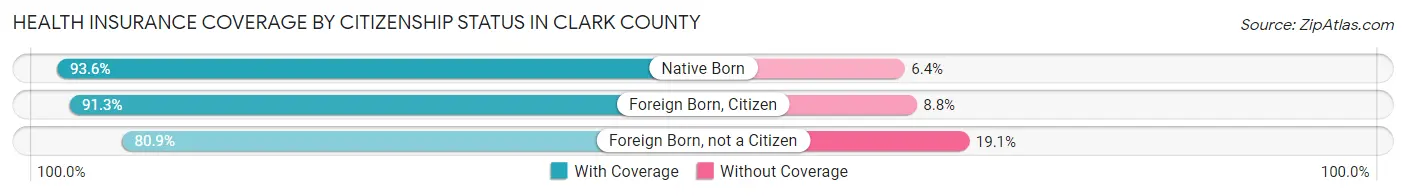
| Citizenship Status | With Coverage | Without Coverage |
| Native Born | 150,809 (93.6%) | 10,319 (6.4%) |
| Foreign Born, Citizen | 346,885 (91.2%) | 33,280 (8.7%) |
| Foreign Born, not a Citizen | 155,009 (80.9%) | 36,556 (19.1%) |
Health Insurance Coverage by Household Income in Clark County
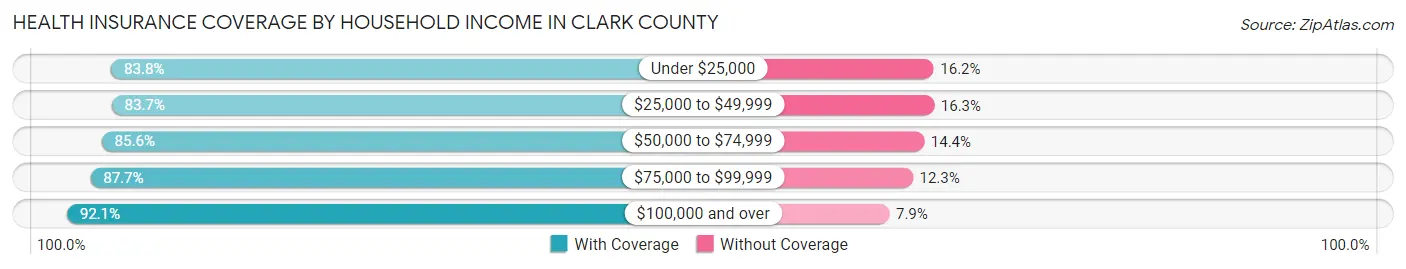
| Household Income | With Coverage | Without Coverage |
| Under $25,000 | 204,252 (83.8%) | 39,551 (16.2%) |
| $25,000 to $49,999 | 311,321 (83.7%) | 60,651 (16.3%) |
| $50,000 to $74,999 | 328,611 (85.6%) | 55,469 (14.4%) |
| $75,000 to $99,999 | 293,107 (87.7%) | 41,199 (12.3%) |
| $100,000 and over | 830,698 (92.1%) | 71,330 (7.9%) |
Public vs Private Health Insurance Coverage by Age in Clark County
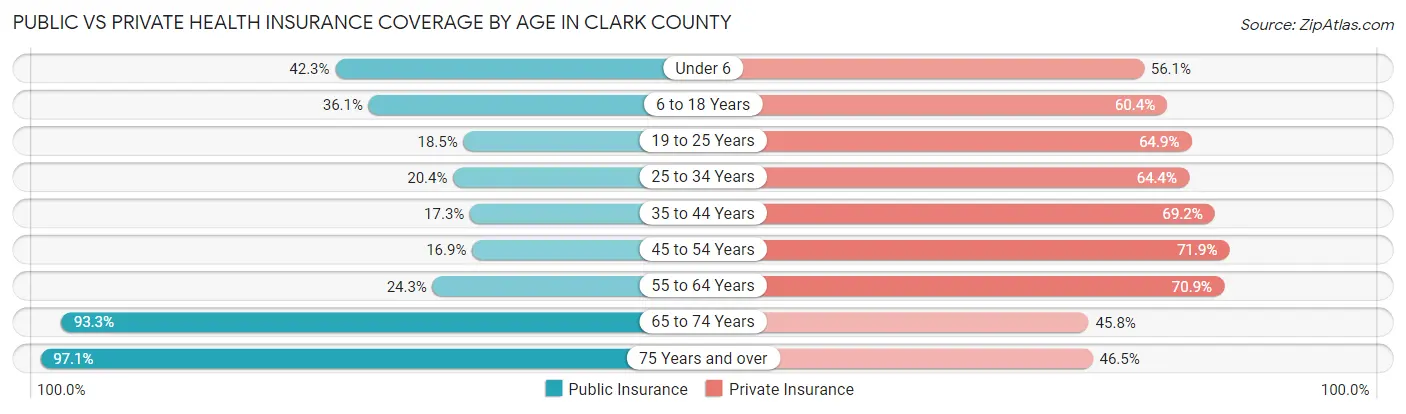
| Age Bracket | Public Insurance | Private Insurance |
| Under 6 | 68,182 (42.3%) | 90,319 (56.0%) |
| 6 to 18 Years | 137,264 (36.1%) | 229,477 (60.4%) |
| 19 to 25 Years | 35,502 (18.5%) | 124,234 (64.8%) |
| 25 to 34 Years | 59,889 (20.4%) | 188,804 (64.4%) |
| 35 to 44 Years | 53,846 (17.3%) | 215,412 (69.2%) |
| 45 to 54 Years | 49,753 (16.9%) | 211,617 (71.9%) |
| 55 to 64 Years | 65,069 (24.2%) | 190,329 (70.9%) |
| 65 to 74 Years | 194,940 (93.3%) | 95,762 (45.8%) |
| 75 Years and over | 128,395 (97.1%) | 61,538 (46.5%) |
| Total | 792,840 (35.4%) | 1,407,492 (62.8%) |
Disability Status by Sex by Age in Clark County
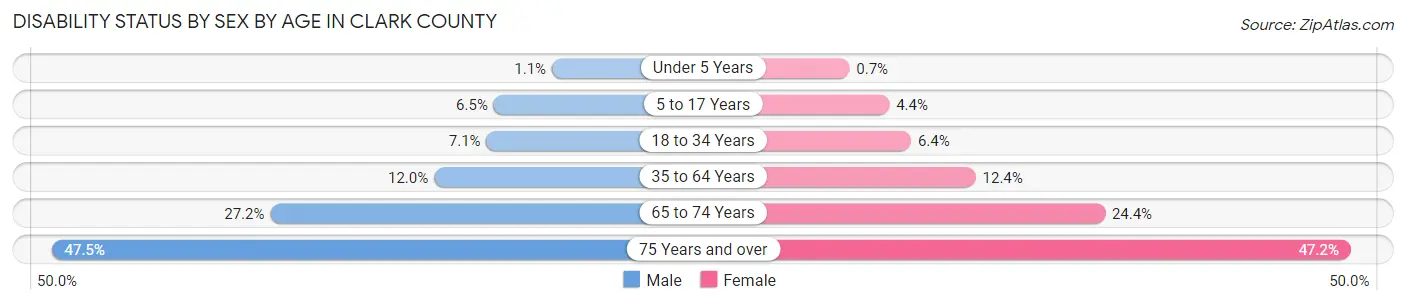
| Age Bracket | Male | Female |
| Under 5 Years | 719 (1.1%) | 453 (0.7%) |
| 5 to 17 Years | 12,579 (6.5%) | 8,209 (4.4%) |
| 18 to 34 Years | 18,352 (7.1%) | 16,344 (6.4%) |
| 35 to 64 Years | 52,785 (12.0%) | 53,912 (12.4%) |
| 65 to 74 Years | 27,000 (27.2%) | 26,789 (24.4%) |
| 75 Years and over | 28,373 (47.5%) | 34,232 (47.2%) |
Disability Class by Sex by Age in Clark County
Disability Class: Hearing Difficulty
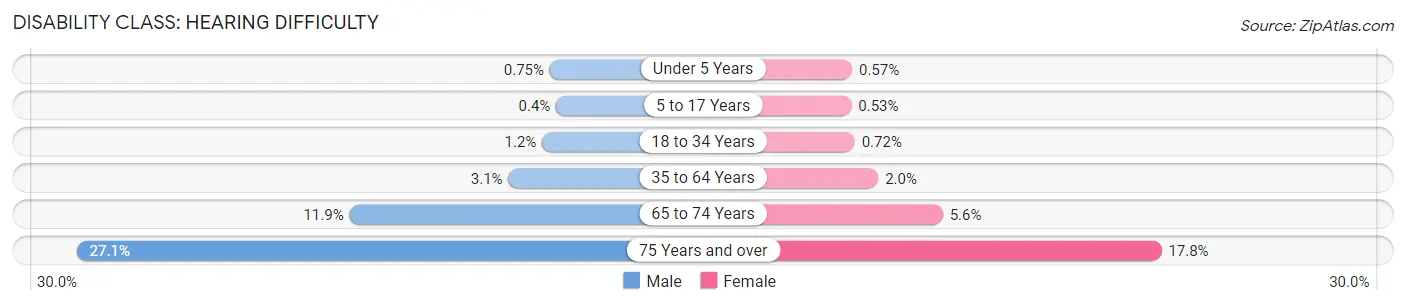
| Age Bracket | Male | Female |
| Under 5 Years | 509 (0.7%) | 368 (0.6%) |
| 5 to 17 Years | 782 (0.4%) | 980 (0.5%) |
| 18 to 34 Years | 3,026 (1.2%) | 1,839 (0.7%) |
| 35 to 64 Years | 13,457 (3.1%) | 8,801 (2.0%) |
| 65 to 74 Years | 11,820 (11.9%) | 6,162 (5.6%) |
| 75 Years and over | 16,191 (27.1%) | 12,900 (17.8%) |
Disability Class: Vision Difficulty
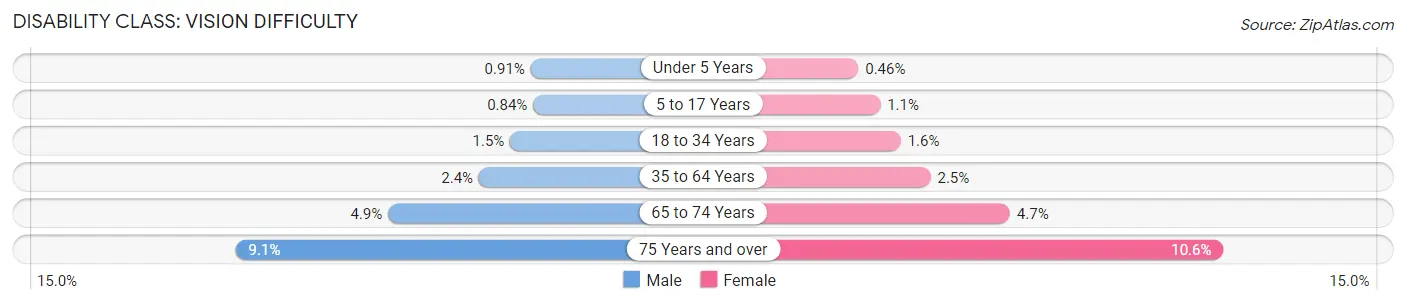
| Age Bracket | Male | Female |
| Under 5 Years | 619 (0.9%) | 299 (0.5%) |
| 5 to 17 Years | 1,639 (0.8%) | 1,988 (1.1%) |
| 18 to 34 Years | 3,803 (1.5%) | 4,164 (1.6%) |
| 35 to 64 Years | 10,339 (2.4%) | 10,744 (2.5%) |
| 65 to 74 Years | 4,844 (4.9%) | 5,133 (4.7%) |
| 75 Years and over | 5,456 (9.1%) | 7,696 (10.6%) |
Disability Class: Cognitive Difficulty
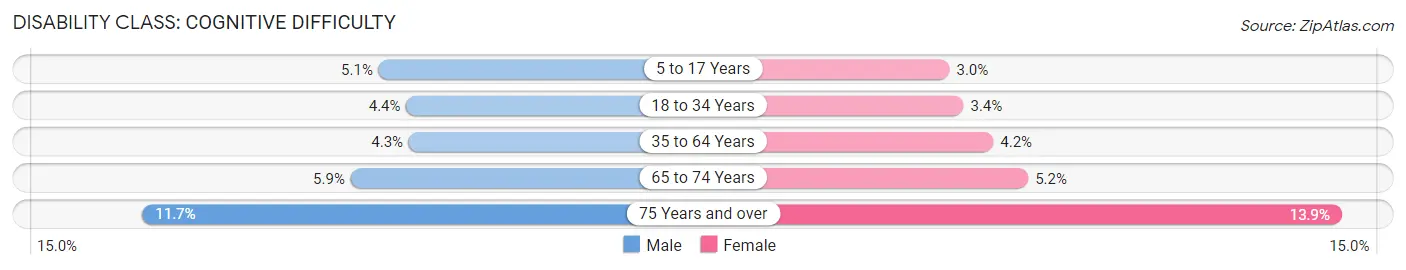
| Age Bracket | Male | Female |
| 5 to 17 Years | 10,007 (5.1%) | 5,594 (3.0%) |
| 18 to 34 Years | 11,219 (4.4%) | 8,627 (3.4%) |
| 35 to 64 Years | 18,889 (4.3%) | 18,334 (4.2%) |
| 65 to 74 Years | 5,874 (5.9%) | 5,693 (5.2%) |
| 75 Years and over | 7,004 (11.7%) | 10,092 (13.9%) |
Disability Class: Ambulatory Difficulty
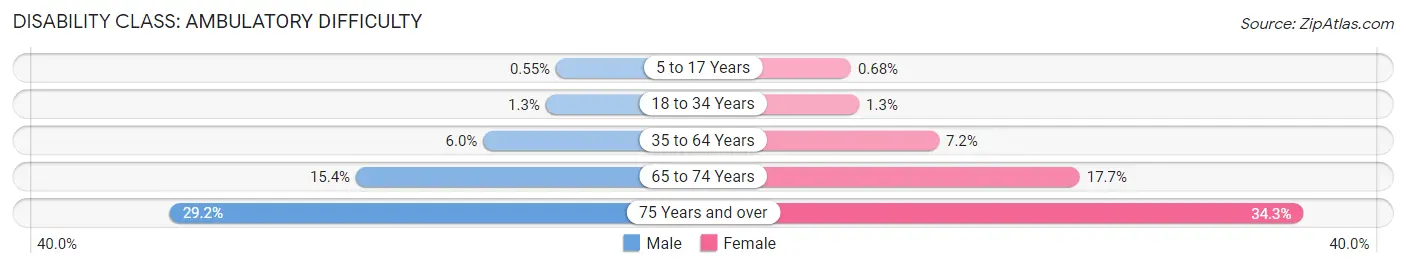
| Age Bracket | Male | Female |
| 5 to 17 Years | 1,067 (0.5%) | 1,271 (0.7%) |
| 18 to 34 Years | 3,366 (1.3%) | 3,286 (1.3%) |
| 35 to 64 Years | 26,161 (5.9%) | 31,348 (7.2%) |
| 65 to 74 Years | 15,291 (15.4%) | 19,390 (17.7%) |
| 75 Years and over | 17,461 (29.2%) | 24,835 (34.3%) |
Disability Class: Self-Care Difficulty

| Age Bracket | Male | Female |
| 5 to 17 Years | 2,503 (1.3%) | 1,594 (0.9%) |
| 18 to 34 Years | 1,812 (0.7%) | 1,585 (0.6%) |
| 35 to 64 Years | 8,521 (1.9%) | 10,512 (2.4%) |
| 65 to 74 Years | 5,307 (5.3%) | 4,825 (4.4%) |
| 75 Years and over | 6,748 (11.3%) | 10,488 (14.5%) |
Technology Access in Clark County
Computing Device Access in Clark County

| Device Type | # Households | % Households |
| Desktop or Laptop | 672,495 | 80.8% |
| Smartphone | 754,450 | 90.6% |
| Tablet | 529,123 | 63.6% |
| No Computing Device | 37,545 | 4.5% |
| Total | 832,367 | 100.0% |
Internet Access in Clark County
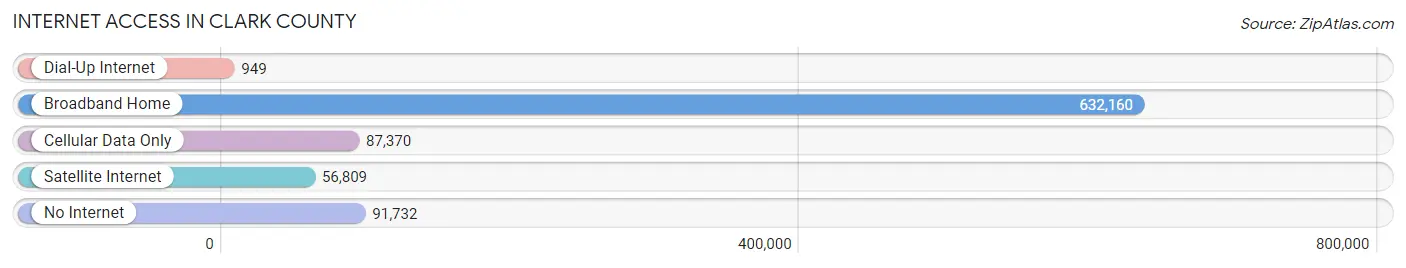
| Internet Type | # Households | % Households |
| Dial-Up Internet | 949 | 0.1% |
| Broadband Home | 632,160 | 75.9% |
| Cellular Data Only | 87,370 | 10.5% |
| Satellite Internet | 56,809 | 6.8% |
| No Internet | 91,732 | 11.0% |
| Total | 832,367 | 100.0% |
Clark County Summary
Clark County, Nevada is located in the southern part of the state and is the most populous county in Nevada. It is home to the Las Vegas metropolitan area, which is the largest metropolitan area in the state. The county was established in 1909 and named after William Andrews Clark, a railroad magnate and United States Senator.
Geography
Clark County covers an area of 8,061 square miles and is the third largest county in the United States. It is bordered by Nye County to the north, Lincoln County to the east, Mohave County, Arizona to the south, and San Bernardino County, California to the west. The county is located in the Mojave Desert and is home to the Spring Mountains, the McCullough Range, and the Sheep Range. The highest point in the county is Charleston Peak, which is 11,918 feet above sea level. The county is also home to Lake Mead, the largest reservoir in the United States.
Economy
The economy of Clark County is largely driven by tourism and gaming. The Las Vegas Strip is the most popular tourist destination in the county and is home to many of the world’s largest hotels and casinos. The county is also home to the Las Vegas Motor Speedway, which hosts NASCAR and other racing events. Other major industries in the county include manufacturing, construction, and health care.
Demographics
As of the 2010 census, Clark County had a population of 1,951,269. The population is racially diverse, with the largest racial group being White (63.2%), followed by Hispanic or Latino (25.2%), African American (7.7%), and Asian (3.2%). The median household income in the county is $51,890 and the median age is 36.7 years.
History
The area that is now Clark County was first inhabited by the Southern Paiute and Mojave tribes. The first non-native settlers arrived in the area in the late 19th century and the county was officially established in 1909. The county was named after William Andrews Clark, a railroad magnate and United States Senator.
In the early 20th century, the county was largely rural and agricultural. The construction of the Hoover Dam in the 1930s brought an influx of workers to the area and helped to spur the growth of the county. The Las Vegas Strip was developed in the 1940s and 1950s and the county’s population began to grow rapidly. The county continued to grow throughout the 20th century and is now the most populous county in Nevada.
Common Questions
What is Per Capita Income in Clark County?
Per Capita income in Clark County is $36,615.
What is the Median Family Income in Clark County?
Median Family Income in Clark County is $82,358.
What is the Median Household income in Clark County?
Median Household Income in Clark County is $69,911.
What is Income or Wage Gap in Clark County?
Income or Wage Gap in Clark County is 18.1%.
Women in Clark County earn 81.9 cents for every dollar earned by a man.
What is Family Income Deficit in Clark County?
Family Income Deficit in Clark County is $11,534.
Families that are below poverty line in Clark County earn $11,534 less on average than the poverty threshold level.
What is Inequality or Gini Index in Clark County?
Inequality or Gini Index in Clark County is 0.47.
What is the Total Population of Clark County?
Total Population of Clark County is 2,265,926.
What is the Total Male Population of Clark County?
Total Male Population of Clark County is 1,137,581.
What is the Total Female Population of Clark County?
Total Female Population of Clark County is 1,128,345.
What is the Ratio of Males per 100 Females in Clark County?
There are 100.82 Males per 100 Females in Clark County.
What is the Ratio of Females per 100 Males in Clark County?
There are 99.19 Females per 100 Males in Clark County.
What is the Median Population Age in Clark County?
Median Population Age in Clark County is 37.8 Years.
What is the Average Family Size in Clark County
Average Family Size in Clark County is 3.4 People.
What is the Average Household Size in Clark County
Average Household Size in Clark County is 2.7 People.
How Large is the Labor Force in Clark County?
There are 1,154,771 People in the Labor Forcein in Clark County.
What is the Percentage of People in the Labor Force in Clark County?
63.8% of People are in the Labor Force in Clark County.
What is the Unemployment Rate in Clark County?
Unemployment Rate in Clark County is 7.7%.