Zip Codes with the Highest Percentage of Population with a Degree in Engineering in Laurel, MS
RELATED REPORTS & OPTIONS
Engineering
Laurel
Compare Zip Codes
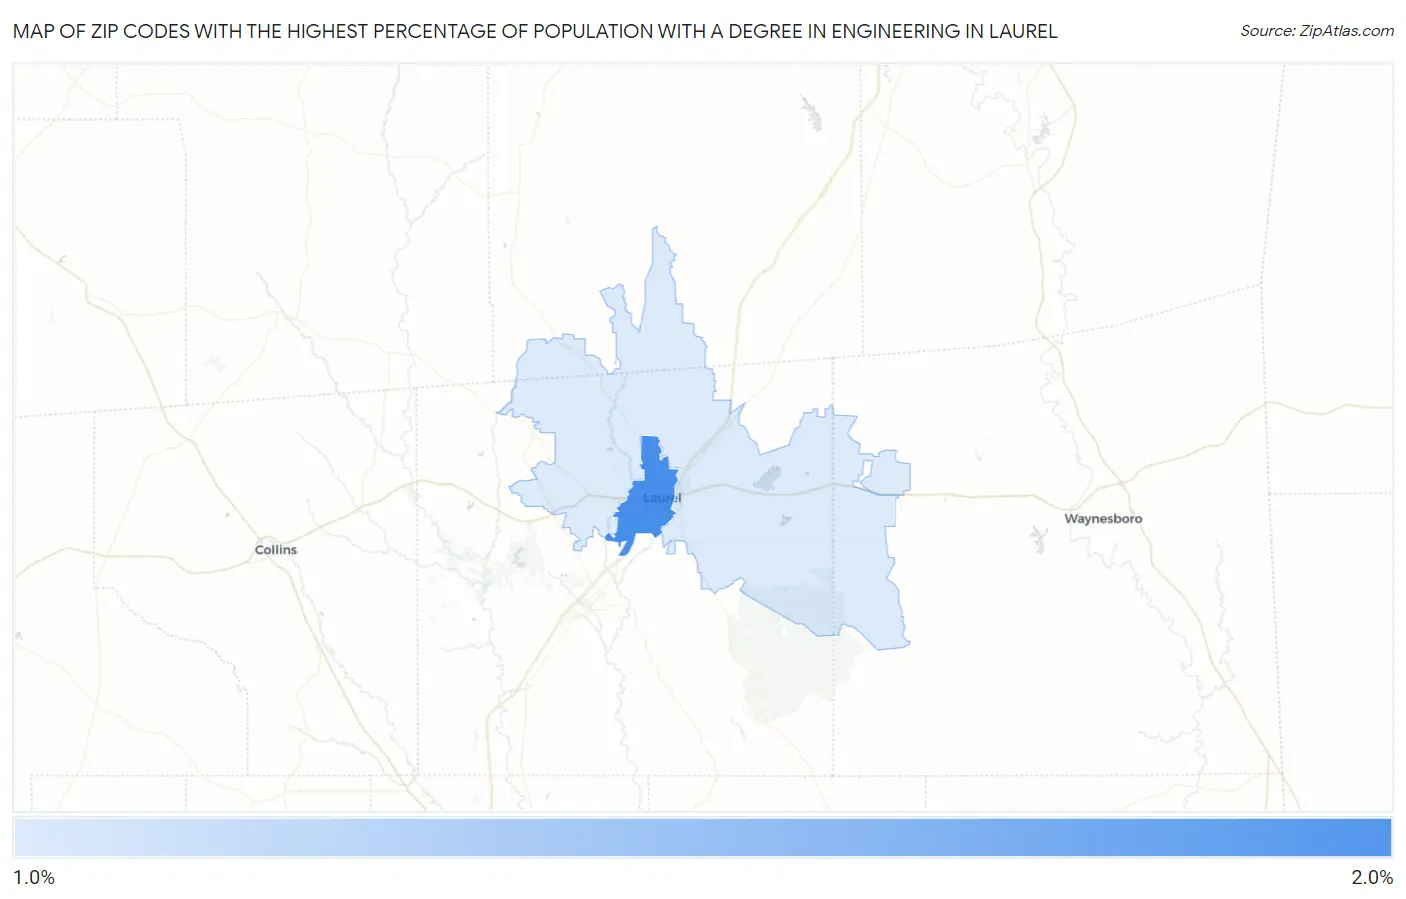
Map of Zip Codes with the Highest Percentage of Population with a Degree in Engineering in Laurel
1.7%
1.9%
Zip Codes with the Highest Percentage of Population with a Degree in Engineering in Laurel, MS
| Zip Code | % Graduates | vs State | vs National | |
| 1. | 39440 | 1.9% | 4.7%(-2.80)#206 | 7.6%(-5.73)#21,110 |
| 2. | 39443 | 1.7% | 4.7%(-3.01)#214 | 7.6%(-5.94)#21,505 |
1
Common Questions
What are the Top Zip Codes with the Highest Percentage of Population with a Degree in Engineering in Laurel, MS?
Top Zip Codes with the Highest Percentage of Population with a Degree in Engineering in Laurel, MS are:
What zip code has the Highest Percentage of Population with a Degree in Engineering in Laurel, MS?
39440 has the Highest Percentage of Population with a Degree in Engineering in Laurel, MS with 1.9%.
What is the Percentage of Population with a Degree in Engineering in Laurel, MS?
Percentage of Population with a Degree in Engineering in Laurel is 2.6%.
What is the Percentage of Population with a Degree in Engineering in Mississippi?
Percentage of Population with a Degree in Engineering in Mississippi is 4.7%.
What is the Percentage of Population with a Degree in Engineering in the United States?
Percentage of Population with a Degree in Engineering in the United States is 7.6%.