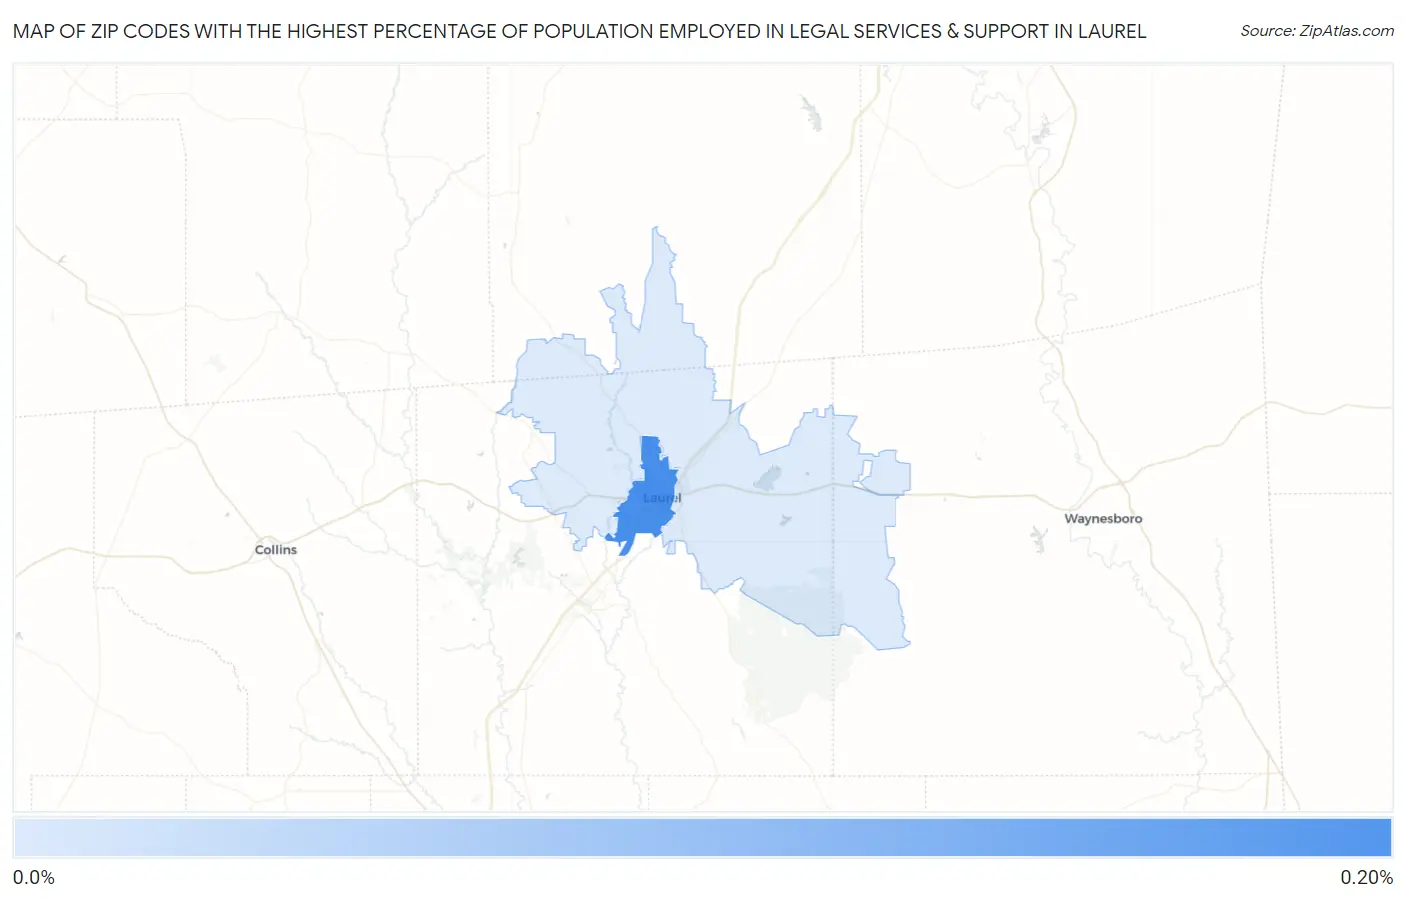
Zip Codes with the Highest Percentage of Population Employed in Legal Services & Support in Laurel, MS
RELATED REPORTS & OPTIONS
Legal Services & Support
Laurel
Compare Zip Codes
Map of Zip Codes with the Highest Percentage of Population Employed in Legal Services & Support in Laurel
0.078%
0.17%
Zip Codes with the Highest Percentage of Population Employed in Legal Services & Support in Laurel, MS
| Zip Code | % Employed | vs State | vs National | |
| 1. | 39440 | 0.17% | 0.75%(-0.571)#154 | 1.2%(-1.01)#16,455 |
| 2. | 39443 | 0.078% | 0.75%(-0.668)#162 | 1.2%(-1.11)#17,282 |
1
Common Questions
What are the Top Zip Codes with the Highest Percentage of Population Employed in Legal Services & Support in Laurel, MS?
Top Zip Codes with the Highest Percentage of Population Employed in Legal Services & Support in Laurel, MS are:
What zip code has the Highest Percentage of Population Employed in Legal Services & Support in Laurel, MS?
39440 has the Highest Percentage of Population Employed in Legal Services & Support in Laurel, MS with 0.17%.
What is the Percentage of Population Employed in Legal Services & Support in Laurel, MS?
Percentage of Population Employed in Legal Services & Support in Laurel is 0.21%.
What is the Percentage of Population Employed in Legal Services & Support in Mississippi?
Percentage of Population Employed in Legal Services & Support in Mississippi is 0.75%.
What is the Percentage of Population Employed in Legal Services & Support in the United States?
Percentage of Population Employed in Legal Services & Support in the United States is 1.2%.