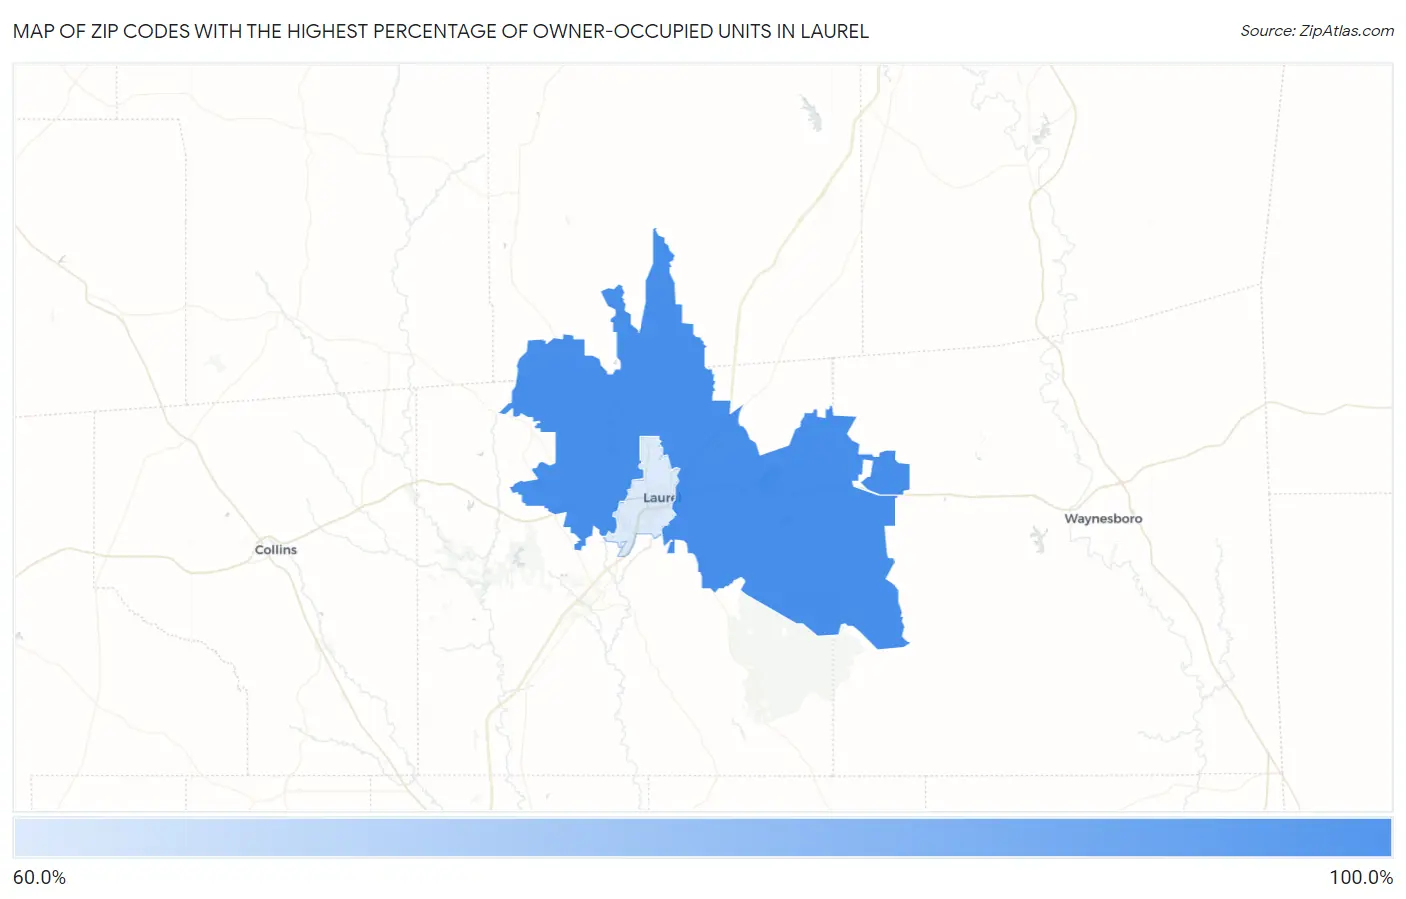
Zip Codes with the Highest Percentage of Owner-Occupied Units in Laurel, MS
RELATED REPORTS & OPTIONS
Highest Owner-Occupied
Laurel
Compare Zip Codes
Map of Zip Codes with the Highest Percentage of Owner-Occupied Units in Laurel
60.3%
80.6%
Zip Codes with the Highest Percentage of Owner-Occupied Units in Laurel, MS
| Zip Code | % Owner-Occupied | vs State | vs National | |
| 1. | 39443 | 80.6% | 69.2%(+11.5)#148 | 64.8%(+15.8)#14,015 |
| 2. | 39440 | 60.3% | 69.2%(-8.90)#328 | 64.8%(-4.55)#27,330 |
1
Common Questions
What are the Top Zip Codes with the Highest Percentage of Owner-Occupied Units in Laurel, MS?
Top Zip Codes with the Highest Percentage of Owner-Occupied Units in Laurel, MS are:
What zip code has the Highest Percentage of Owner-Occupied Units in Laurel, MS?
39443 has the Highest Percentage of Owner-Occupied Units in Laurel, MS with 80.6%.
What is the Percentage of Owner-Occupied Units in Laurel, MS?
Percentage of Owner-Occupied Units in Laurel is 63.5%.
What is the Percentage of Owner-Occupied Units in Mississippi?
Percentage of Owner-Occupied Units in Mississippi is 69.2%.
What is the Percentage of Owner-Occupied Units in the United States?
Percentage of Owner-Occupied Units in the United States is 64.8%.