Tsimshian vs Immigrants from South America Wage/Income Gap
COMPARE
Tsimshian
Immigrants from South America
Wage/Income Gap
Wage/Income Gap Comparison
Tsimshian
Immigrants from South America
23.9%
WAGE/INCOME GAP
98.9/ 100
METRIC RATING
103rd/ 347
METRIC RANK
24.6%
WAGE/INCOME GAP
93.9/ 100
METRIC RATING
124th/ 347
METRIC RANK
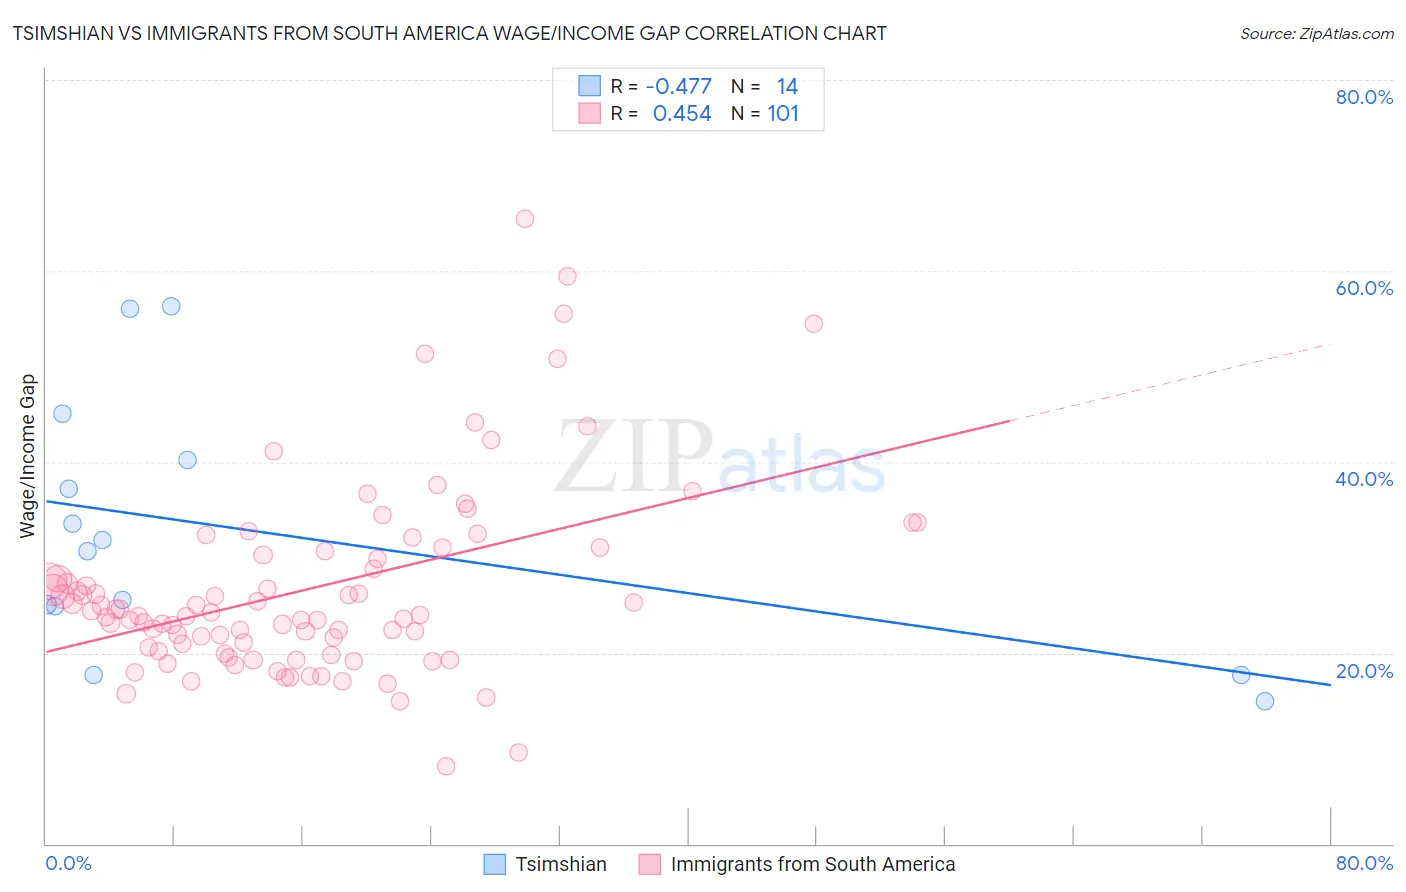
Tsimshian vs Immigrants from South America Wage/Income Gap Correlation Chart
The statistical analysis conducted on geographies consisting of 15,623,634 people shows a moderate negative correlation between the proportion of Tsimshian and wage/income gap percentage in the United States with a correlation coefficient (R) of -0.477 and weighted average of 23.9%. Similarly, the statistical analysis conducted on geographies consisting of 485,807,349 people shows a moderate positive correlation between the proportion of Immigrants from South America and wage/income gap percentage in the United States with a correlation coefficient (R) of 0.454 and weighted average of 24.6%, a difference of 3.1%.
Wage/Income Gap Correlation Summary
| Measurement | Tsimshian | Immigrants from South America |
| Minimum | 14.9% | 8.2% |
| Maximum | 56.3% | 65.5% |
| Range | 41.4% | 57.3% |
| Mean | 32.6% | 26.7% |
| Median | 31.2% | 24.0% |
| Interquartile 25% (IQ1) | 24.9% | 20.4% |
| Interquartile 75% (IQ3) | 40.2% | 30.4% |
| Interquartile Range (IQR) | 15.3% | 10.0% |
| Standard Deviation (Sample) | 13.2% | 10.1% |
| Standard Deviation (Population) | 12.7% | 10.0% |
Similar Demographics by Wage/Income Gap
Demographics Similar to Tsimshian by Wage/Income Gap
In terms of wage/income gap, the demographic groups most similar to Tsimshian are Immigrants from Laos (23.8%, a difference of 0.23%), Tlingit-Haida (24.0%, a difference of 0.33%), Japanese (23.8%, a difference of 0.37%), Moroccan (24.0%, a difference of 0.39%), and Sudanese (24.0%, a difference of 0.39%).
| Demographics | Rating | Rank | Wage/Income Gap |
| Kiowa | 99.4 /100 | #96 | Exceptional 23.6% |
| Immigrants | Sudan | 99.4 /100 | #97 | Exceptional 23.6% |
| Immigrants | Latin America | 99.2 /100 | #98 | Exceptional 23.7% |
| Aleuts | 99.2 /100 | #99 | Exceptional 23.7% |
| Yakama | 99.2 /100 | #100 | Exceptional 23.7% |
| Japanese | 99.1 /100 | #101 | Exceptional 23.8% |
| Immigrants | Laos | 99.0 /100 | #102 | Exceptional 23.8% |
| Tsimshian | 98.9 /100 | #103 | Exceptional 23.9% |
| Tlingit-Haida | 98.7 /100 | #104 | Exceptional 24.0% |
| Moroccans | 98.6 /100 | #105 | Exceptional 24.0% |
| Sudanese | 98.6 /100 | #106 | Exceptional 24.0% |
| Yaqui | 98.4 /100 | #107 | Exceptional 24.0% |
| Immigrants | Albania | 98.4 /100 | #108 | Exceptional 24.0% |
| Ugandans | 98.3 /100 | #109 | Exceptional 24.1% |
| Immigrants | Morocco | 98.1 /100 | #110 | Exceptional 24.1% |
Demographics Similar to Immigrants from South America by Wage/Income Gap
In terms of wage/income gap, the demographic groups most similar to Immigrants from South America are Spanish American (24.6%, a difference of 0.020%), Immigrants from Uruguay (24.6%, a difference of 0.040%), German Russian (24.6%, a difference of 0.050%), Immigrants from Central America (24.6%, a difference of 0.11%), and Yup'ik (24.7%, a difference of 0.17%).
| Demographics | Rating | Rank | Wage/Income Gap |
| Immigrants | Afghanistan | 95.9 /100 | #117 | Exceptional 24.4% |
| Immigrants | Micronesia | 95.8 /100 | #118 | Exceptional 24.4% |
| Kenyans | 95.8 /100 | #119 | Exceptional 24.5% |
| Cree | 95.6 /100 | #120 | Exceptional 24.5% |
| Immigrants | Thailand | 94.9 /100 | #121 | Exceptional 24.5% |
| Apache | 94.8 /100 | #122 | Exceptional 24.5% |
| Natives/Alaskans | 94.6 /100 | #123 | Exceptional 24.6% |
| Immigrants | South America | 93.9 /100 | #124 | Exceptional 24.6% |
| Spanish Americans | 93.8 /100 | #125 | Exceptional 24.6% |
| Immigrants | Uruguay | 93.8 /100 | #126 | Exceptional 24.6% |
| German Russians | 93.7 /100 | #127 | Exceptional 24.6% |
| Immigrants | Central America | 93.5 /100 | #128 | Exceptional 24.6% |
| Yup'ik | 93.3 /100 | #129 | Exceptional 24.7% |
| Alsatians | 93.2 /100 | #130 | Exceptional 24.7% |
| Immigrants | Philippines | 93.0 /100 | #131 | Exceptional 24.7% |