Seminole vs Barbadian In Labor Force | Age > 16
COMPARE
Seminole
Barbadian
In Labor Force | Age > 16
In Labor Force | Age > 16 Comparison
Seminole
Barbadians
62.0%
IN LABOR FORCE | AGE > 16
0.0/ 100
METRIC RATING
323rd/ 347
METRIC RANK
65.0%
IN LABOR FORCE | AGE > 16
33.9/ 100
METRIC RATING
190th/ 347
METRIC RANK
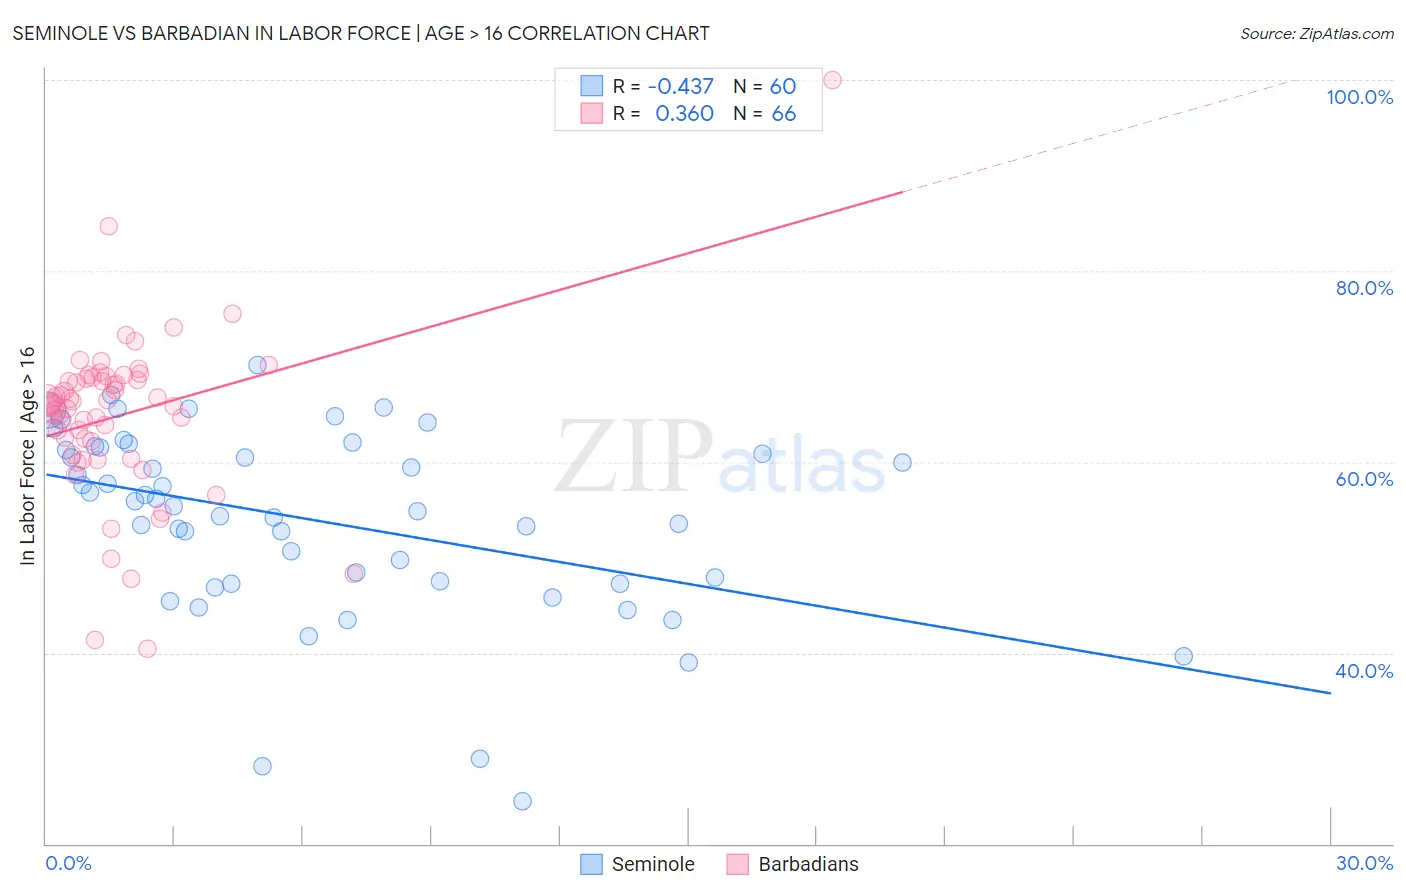
Seminole vs Barbadian In Labor Force | Age > 16 Correlation Chart
The statistical analysis conducted on geographies consisting of 118,310,187 people shows a moderate negative correlation between the proportion of Seminole and labor force participation rate among population ages 16 and over in the United States with a correlation coefficient (R) of -0.437 and weighted average of 62.0%. Similarly, the statistical analysis conducted on geographies consisting of 141,304,779 people shows a mild positive correlation between the proportion of Barbadians and labor force participation rate among population ages 16 and over in the United States with a correlation coefficient (R) of 0.360 and weighted average of 65.0%, a difference of 4.8%.
In Labor Force | Age > 16 Correlation Summary
| Measurement | Seminole | Barbadian |
| Minimum | 24.4% | 40.4% |
| Maximum | 70.1% | 100.0% |
| Range | 45.7% | 59.6% |
| Mean | 53.9% | 64.9% |
| Median | 55.6% | 66.1% |
| Interquartile 25% (IQ1) | 47.4% | 62.2% |
| Interquartile 75% (IQ3) | 61.4% | 68.8% |
| Interquartile Range (IQR) | 14.1% | 6.6% |
| Standard Deviation (Sample) | 9.8% | 8.7% |
| Standard Deviation (Population) | 9.7% | 8.6% |
Similar Demographics by In Labor Force | Age > 16
Demographics Similar to Seminole by In Labor Force | Age > 16
In terms of in labor force | age > 16, the demographic groups most similar to Seminole are Ottawa (62.0%, a difference of 0.030%), Cheyenne (62.0%, a difference of 0.040%), Cherokee (61.9%, a difference of 0.090%), American (62.1%, a difference of 0.18%), and Arapaho (62.1%, a difference of 0.22%).
| Demographics | Rating | Rank | In Labor Force | Age > 16 |
| Yup'ik | 0.0 /100 | #316 | Tragic 62.7% |
| Kiowa | 0.0 /100 | #317 | Tragic 62.4% |
| Chickasaw | 0.0 /100 | #318 | Tragic 62.3% |
| Arapaho | 0.0 /100 | #319 | Tragic 62.1% |
| Yakama | 0.0 /100 | #320 | Tragic 62.1% |
| Americans | 0.0 /100 | #321 | Tragic 62.1% |
| Ottawa | 0.0 /100 | #322 | Tragic 62.0% |
| Seminole | 0.0 /100 | #323 | Tragic 62.0% |
| Cheyenne | 0.0 /100 | #324 | Tragic 62.0% |
| Cherokee | 0.0 /100 | #325 | Tragic 61.9% |
| Sioux | 0.0 /100 | #326 | Tragic 61.8% |
| Cajuns | 0.0 /100 | #327 | Tragic 61.8% |
| Dutch West Indians | 0.0 /100 | #328 | Tragic 61.7% |
| Choctaw | 0.0 /100 | #329 | Tragic 61.5% |
| Creek | 0.0 /100 | #330 | Tragic 61.3% |
Demographics Similar to Barbadians by In Labor Force | Age > 16
In terms of in labor force | age > 16, the demographic groups most similar to Barbadians are Immigrants from Greece (65.0%, a difference of 0.0%), Scandinavian (65.0%, a difference of 0.0%), Immigrants from Fiji (65.0%, a difference of 0.0%), Immigrants from Europe (65.0%, a difference of 0.0%), and Immigrants from Portugal (65.0%, a difference of 0.010%).
| Demographics | Rating | Rank | In Labor Force | Age > 16 |
| Soviet Union | 40.5 /100 | #183 | Average 65.0% |
| Carpatho Rusyns | 40.0 /100 | #184 | Average 65.0% |
| Syrians | 40.0 /100 | #185 | Average 65.0% |
| Immigrants | Switzerland | 38.2 /100 | #186 | Fair 65.0% |
| Immigrants | Croatia | 35.7 /100 | #187 | Fair 65.0% |
| Immigrants | Portugal | 34.8 /100 | #188 | Fair 65.0% |
| Immigrants | Greece | 34.3 /100 | #189 | Fair 65.0% |
| Barbadians | 33.9 /100 | #190 | Fair 65.0% |
| Scandinavians | 33.7 /100 | #191 | Fair 65.0% |
| Immigrants | Fiji | 33.7 /100 | #192 | Fair 65.0% |
| Immigrants | Europe | 33.6 /100 | #193 | Fair 65.0% |
| Immigrants | Southern Europe | 31.3 /100 | #194 | Fair 65.0% |
| Romanians | 31.1 /100 | #195 | Fair 65.0% |
| Haitians | 30.6 /100 | #196 | Fair 65.0% |
| Immigrants | Italy | 28.7 /100 | #197 | Fair 65.0% |