English vs Barbadian Wage/Income Gap
COMPARE
English
Barbadian
Wage/Income Gap
Wage/Income Gap Comparison
English
Barbadians
29.5%
WAGE/INCOME GAP
0.0/ 100
METRIC RATING
336th/ 347
METRIC RANK
19.0%
WAGE/INCOME GAP
100.0/ 100
METRIC RATING
9th/ 347
METRIC RANK
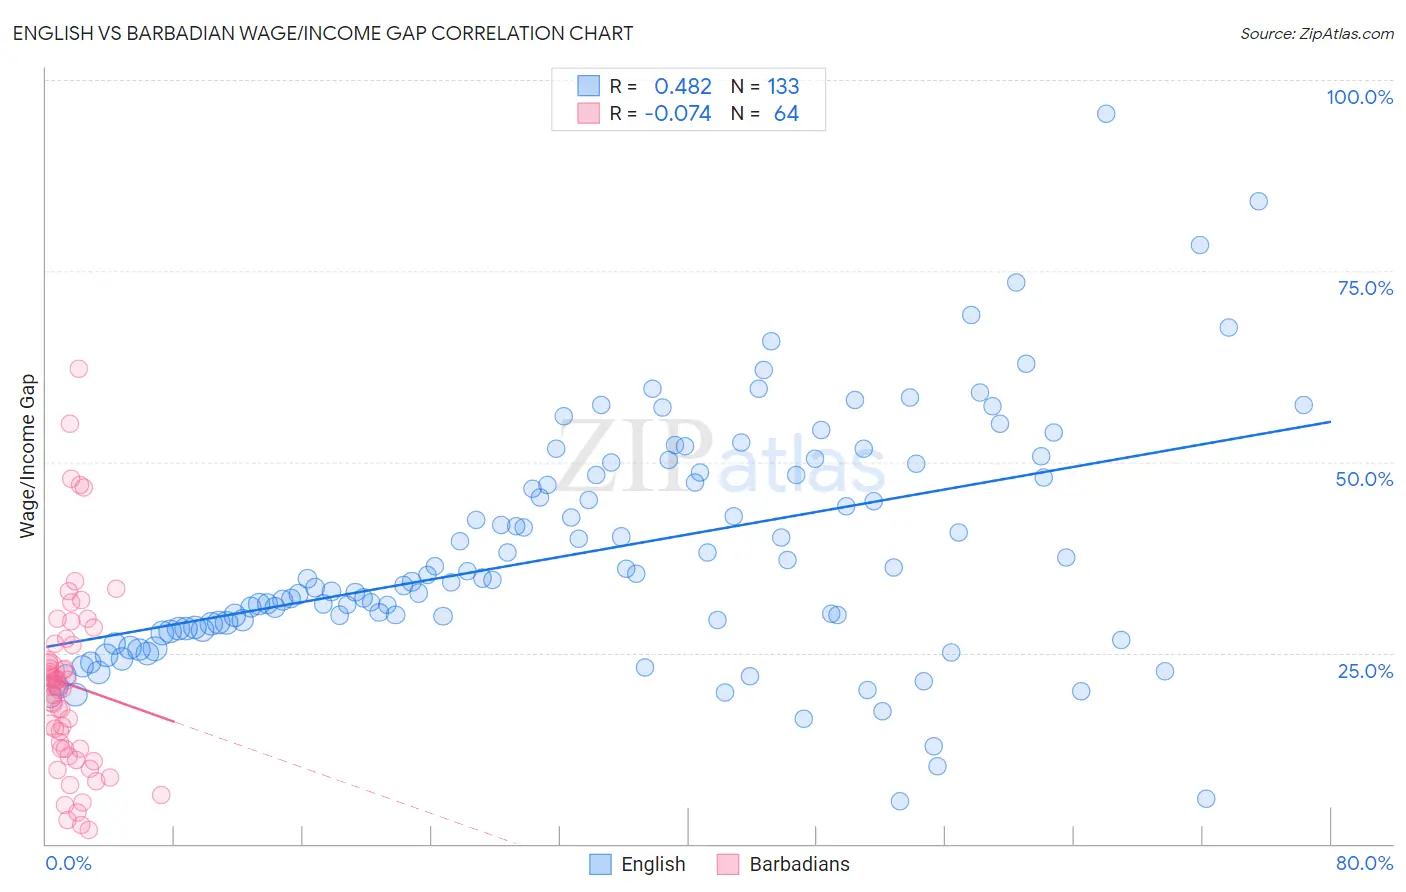
English vs Barbadian Wage/Income Gap Correlation Chart
The statistical analysis conducted on geographies consisting of 575,625,723 people shows a moderate positive correlation between the proportion of English and wage/income gap percentage in the United States with a correlation coefficient (R) of 0.482 and weighted average of 29.5%. Similarly, the statistical analysis conducted on geographies consisting of 141,295,930 people shows a slight negative correlation between the proportion of Barbadians and wage/income gap percentage in the United States with a correlation coefficient (R) of -0.074 and weighted average of 19.0%, a difference of 55.4%.
Wage/Income Gap Correlation Summary
| Measurement | English | Barbadian |
| Minimum | 5.6% | 1.8% |
| Maximum | 95.6% | 62.3% |
| Range | 90.1% | 60.4% |
| Mean | 38.2% | 20.9% |
| Median | 34.6% | 20.6% |
| Interquartile 25% (IQ1) | 28.2% | 12.4% |
| Interquartile 75% (IQ3) | 48.5% | 26.1% |
| Interquartile Range (IQR) | 20.3% | 13.7% |
| Standard Deviation (Sample) | 15.5% | 12.3% |
| Standard Deviation (Population) | 15.4% | 12.2% |
Similar Demographics by Wage/Income Gap
Demographics Similar to English by Wage/Income Gap
In terms of wage/income gap, the demographic groups most similar to English are Immigrants from Taiwan (29.5%, a difference of 0.010%), Swedish (29.4%, a difference of 0.14%), European (29.4%, a difference of 0.28%), Immigrants from South Central Asia (29.3%, a difference of 0.47%), and Dutch (29.6%, a difference of 0.58%).
| Demographics | Rating | Rank | Wage/Income Gap |
| Scottish | 0.0 /100 | #329 | Tragic 29.1% |
| Germans | 0.0 /100 | #330 | Tragic 29.2% |
| Czechs | 0.0 /100 | #331 | Tragic 29.2% |
| Immigrants | South Central Asia | 0.0 /100 | #332 | Tragic 29.3% |
| Europeans | 0.0 /100 | #333 | Tragic 29.4% |
| Swedes | 0.0 /100 | #334 | Tragic 29.4% |
| Immigrants | Taiwan | 0.0 /100 | #335 | Tragic 29.5% |
| English | 0.0 /100 | #336 | Tragic 29.5% |
| Dutch | 0.0 /100 | #337 | Tragic 29.6% |
| Filipinos | 0.0 /100 | #338 | Tragic 29.7% |
| Iranians | 0.0 /100 | #339 | Tragic 29.7% |
| Swiss | 0.0 /100 | #340 | Tragic 30.0% |
| Thais | 0.0 /100 | #341 | Tragic 30.5% |
| Pennsylvania Germans | 0.0 /100 | #342 | Tragic 30.7% |
| Danes | 0.0 /100 | #343 | Tragic 31.0% |
Demographics Similar to Barbadians by Wage/Income Gap
In terms of wage/income gap, the demographic groups most similar to Barbadians are Crow (19.1%, a difference of 0.53%), Immigrants from Jamaica (18.8%, a difference of 0.66%), Puerto Rican (18.7%, a difference of 1.3%), Immigrants from Haiti (19.2%, a difference of 1.3%), and Immigrants from West Indies (19.2%, a difference of 1.4%).
| Demographics | Rating | Rank | Wage/Income Gap |
| Immigrants | St. Vincent and the Grenadines | 100.0 /100 | #2 | Exceptional 16.4% |
| Immigrants | Barbados | 100.0 /100 | #3 | Exceptional 17.8% |
| British West Indians | 100.0 /100 | #4 | Exceptional 18.0% |
| Guyanese | 100.0 /100 | #5 | Exceptional 18.3% |
| Immigrants | Guyana | 100.0 /100 | #6 | Exceptional 18.4% |
| Puerto Ricans | 100.0 /100 | #7 | Exceptional 18.7% |
| Immigrants | Jamaica | 100.0 /100 | #8 | Exceptional 18.8% |
| Barbadians | 100.0 /100 | #9 | Exceptional 19.0% |
| Crow | 100.0 /100 | #10 | Exceptional 19.1% |
| Immigrants | Haiti | 100.0 /100 | #11 | Exceptional 19.2% |
| Immigrants | West Indies | 100.0 /100 | #12 | Exceptional 19.2% |
| Trinidadians and Tobagonians | 100.0 /100 | #13 | Exceptional 19.3% |
| Immigrants | Trinidad and Tobago | 100.0 /100 | #14 | Exceptional 19.3% |
| West Indians | 100.0 /100 | #15 | Exceptional 19.6% |
| Jamaicans | 100.0 /100 | #16 | Exceptional 19.6% |