Immigrants from Zaire vs Pennsylvania German Householder Income Over 65 years
COMPARE
Immigrants from Zaire
Pennsylvania German
Householder Income Over 65 years
Householder Income Over 65 years Comparison
Immigrants from Zaire
Pennsylvania Germans
$54,512
HOUSEHOLDER INCOME OVER 65 YEARS
0.1/ 100
METRIC RATING
268th/ 347
METRIC RANK
$52,888
HOUSEHOLDER INCOME OVER 65 YEARS
0.0/ 100
METRIC RATING
306th/ 347
METRIC RANK
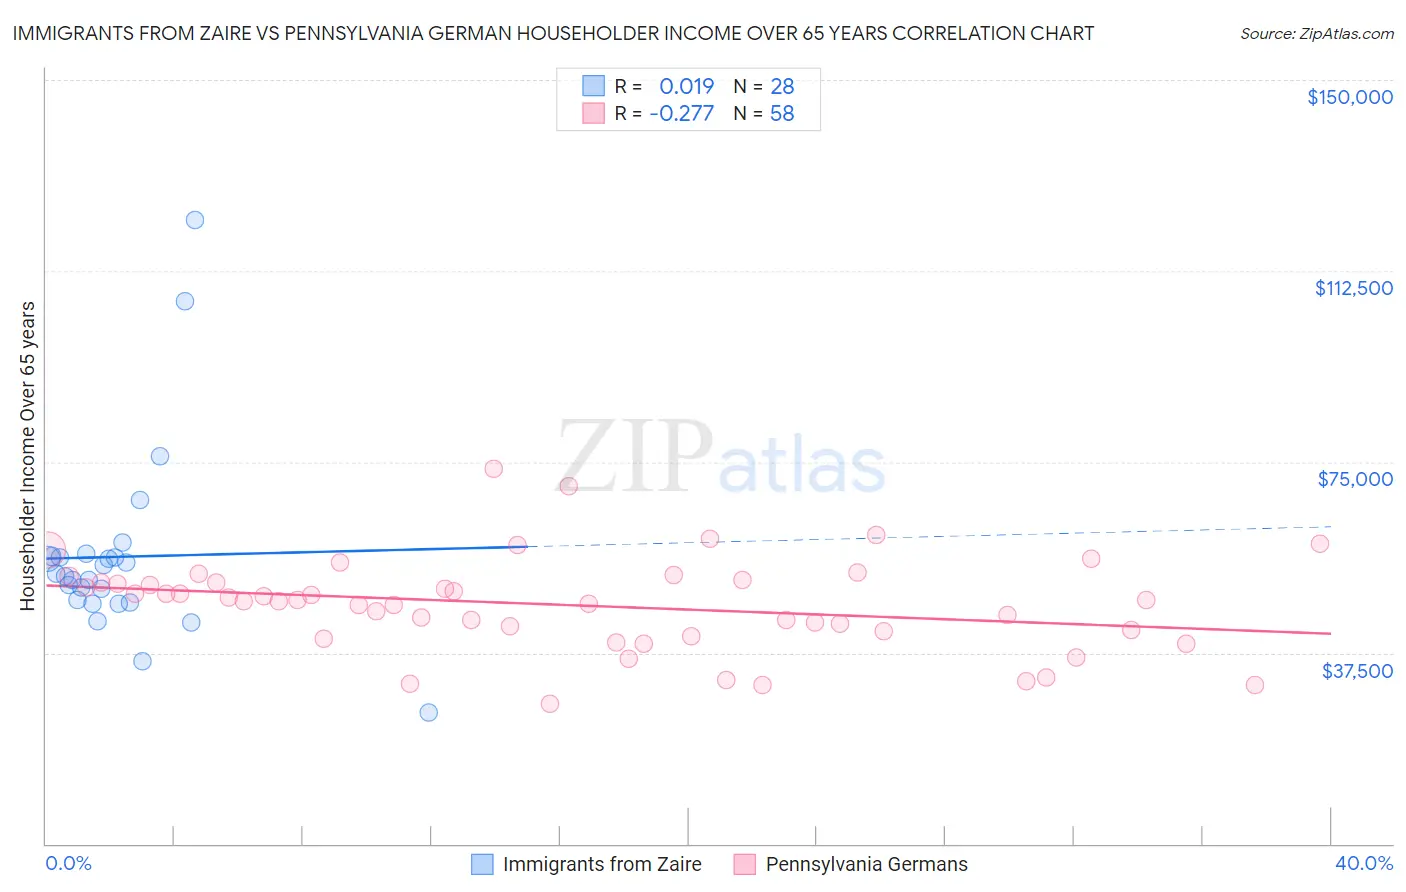
Immigrants from Zaire vs Pennsylvania German Householder Income Over 65 years Correlation Chart
The statistical analysis conducted on geographies consisting of 107,158,752 people shows no correlation between the proportion of Immigrants from Zaire and household income with householder over the age of 65 in the United States with a correlation coefficient (R) of 0.019 and weighted average of $54,512. Similarly, the statistical analysis conducted on geographies consisting of 233,753,814 people shows a weak negative correlation between the proportion of Pennsylvania Germans and household income with householder over the age of 65 in the United States with a correlation coefficient (R) of -0.277 and weighted average of $52,888, a difference of 3.1%.
Householder Income Over 65 years Correlation Summary
| Measurement | Immigrants from Zaire | Pennsylvania German |
| Minimum | $25,694 | $27,515 |
| Maximum | $122,500 | $73,750 |
| Range | $96,806 | $46,235 |
| Mean | $56,341 | $46,892 |
| Median | $52,820 | $47,645 |
| Interquartile 25% (IQ1) | $47,556 | $41,667 |
| Interquartile 75% (IQ3) | $56,369 | $51,391 |
| Interquartile Range (IQR) | $8,813 | $9,724 |
| Standard Deviation (Sample) | $18,869 | $9,206 |
| Standard Deviation (Population) | $18,529 | $9,127 |
Similar Demographics by Householder Income Over 65 years
Demographics Similar to Immigrants from Zaire by Householder Income Over 65 years
In terms of householder income over 65 years, the demographic groups most similar to Immigrants from Zaire are Guatemalan ($54,526, a difference of 0.030%), Nicaraguan ($54,474, a difference of 0.070%), Jamaican ($54,560, a difference of 0.090%), Immigrants from Senegal ($54,447, a difference of 0.12%), and Belizean ($54,580, a difference of 0.13%).
| Demographics | Rating | Rank | Householder Income Over 65 years |
| Comanche | 0.2 /100 | #261 | Tragic $54,922 |
| Bangladeshis | 0.1 /100 | #262 | Tragic $54,719 |
| French American Indians | 0.1 /100 | #263 | Tragic $54,699 |
| Apache | 0.1 /100 | #264 | Tragic $54,668 |
| Belizeans | 0.1 /100 | #265 | Tragic $54,580 |
| Jamaicans | 0.1 /100 | #266 | Tragic $54,560 |
| Guatemalans | 0.1 /100 | #267 | Tragic $54,526 |
| Immigrants | Zaire | 0.1 /100 | #268 | Tragic $54,512 |
| Nicaraguans | 0.1 /100 | #269 | Tragic $54,474 |
| Immigrants | Senegal | 0.1 /100 | #270 | Tragic $54,447 |
| Liberians | 0.1 /100 | #271 | Tragic $54,356 |
| Potawatomi | 0.1 /100 | #272 | Tragic $54,212 |
| Indonesians | 0.1 /100 | #273 | Tragic $54,176 |
| Barbadians | 0.1 /100 | #274 | Tragic $54,163 |
| Cherokee | 0.1 /100 | #275 | Tragic $54,133 |
Demographics Similar to Pennsylvania Germans by Householder Income Over 65 years
In terms of householder income over 65 years, the demographic groups most similar to Pennsylvania Germans are Pueblo ($52,930, a difference of 0.080%), Ute ($52,949, a difference of 0.11%), Hispanic or Latino ($52,832, a difference of 0.11%), Immigrants from Mexico ($52,801, a difference of 0.17%), and Choctaw ($53,060, a difference of 0.32%).
| Demographics | Rating | Rank | Householder Income Over 65 years |
| Ottawa | 0.0 /100 | #299 | Tragic $53,217 |
| Immigrants | Bahamas | 0.0 /100 | #300 | Tragic $53,174 |
| Yuman | 0.0 /100 | #301 | Tragic $53,110 |
| Spanish American Indians | 0.0 /100 | #302 | Tragic $53,077 |
| Choctaw | 0.0 /100 | #303 | Tragic $53,060 |
| Ute | 0.0 /100 | #304 | Tragic $52,949 |
| Pueblo | 0.0 /100 | #305 | Tragic $52,930 |
| Pennsylvania Germans | 0.0 /100 | #306 | Tragic $52,888 |
| Hispanics or Latinos | 0.0 /100 | #307 | Tragic $52,832 |
| Immigrants | Mexico | 0.0 /100 | #308 | Tragic $52,801 |
| Hondurans | 0.0 /100 | #309 | Tragic $52,634 |
| Sioux | 0.0 /100 | #310 | Tragic $52,509 |
| Seminole | 0.0 /100 | #311 | Tragic $52,373 |
| Immigrants | Azores | 0.0 /100 | #312 | Tragic $52,121 |
| Immigrants | Nicaragua | 0.0 /100 | #313 | Tragic $52,085 |