Inupiat vs Pennsylvania German Householder Income Over 65 years
COMPARE
Inupiat
Pennsylvania German
Householder Income Over 65 years
Householder Income Over 65 years Comparison
Inupiat
Pennsylvania Germans
$61,061
HOUSEHOLDER INCOME OVER 65 YEARS
52.4/ 100
METRIC RATING
171st/ 347
METRIC RANK
$52,888
HOUSEHOLDER INCOME OVER 65 YEARS
0.0/ 100
METRIC RATING
306th/ 347
METRIC RANK
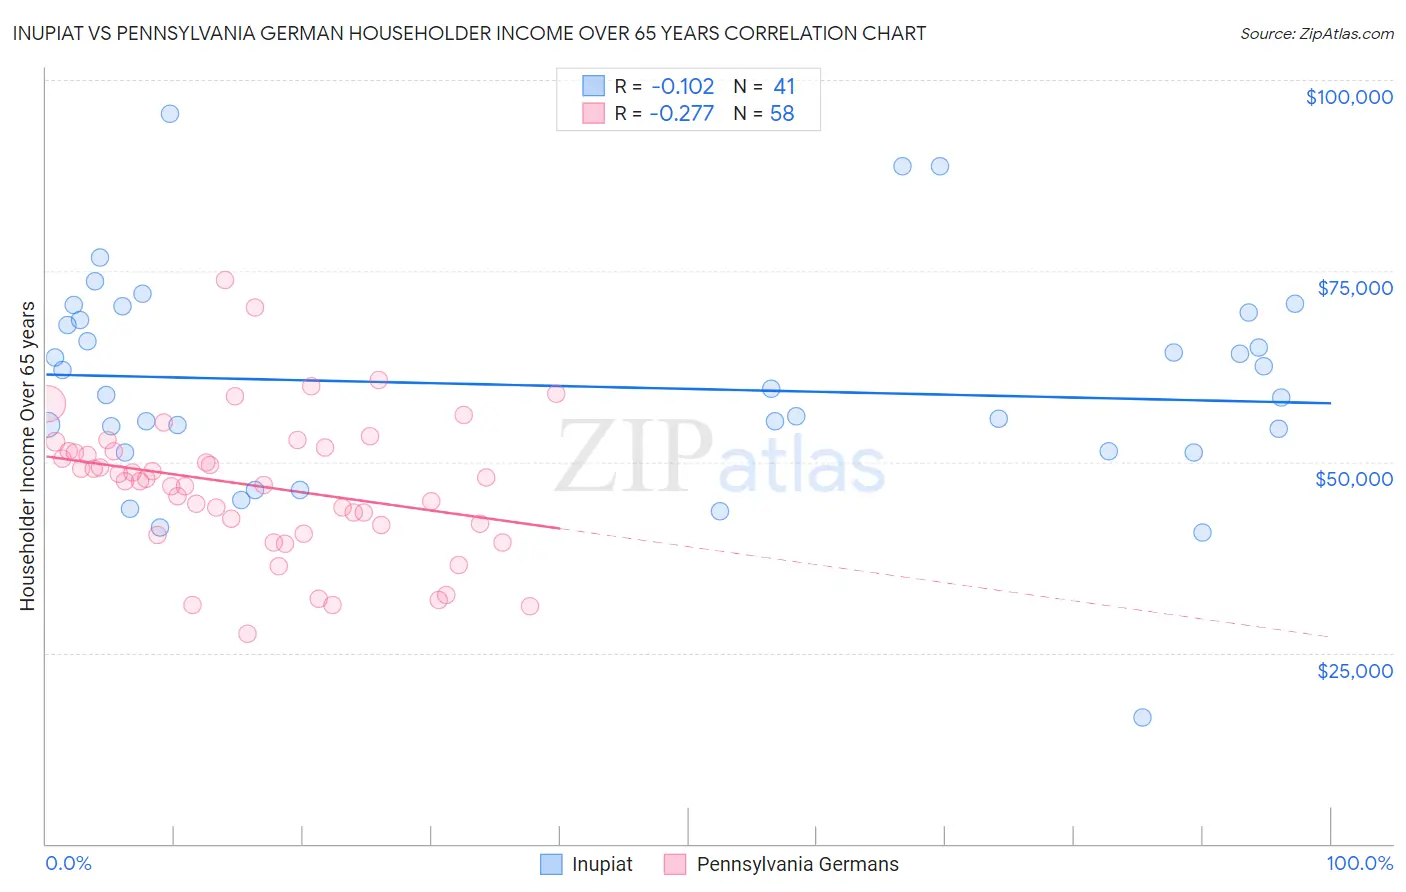
Inupiat vs Pennsylvania German Householder Income Over 65 years Correlation Chart
The statistical analysis conducted on geographies consisting of 96,206,206 people shows a poor negative correlation between the proportion of Inupiat and household income with householder over the age of 65 in the United States with a correlation coefficient (R) of -0.102 and weighted average of $61,061. Similarly, the statistical analysis conducted on geographies consisting of 233,753,814 people shows a weak negative correlation between the proportion of Pennsylvania Germans and household income with householder over the age of 65 in the United States with a correlation coefficient (R) of -0.277 and weighted average of $52,888, a difference of 15.4%.
Householder Income Over 65 years Correlation Summary
| Measurement | Inupiat | Pennsylvania German |
| Minimum | $16,607 | $27,515 |
| Maximum | $95,647 | $73,750 |
| Range | $79,040 | $46,235 |
| Mean | $59,905 | $46,892 |
| Median | $58,687 | $47,645 |
| Interquartile 25% (IQ1) | $51,307 | $41,667 |
| Interquartile 75% (IQ3) | $69,101 | $51,391 |
| Interquartile Range (IQR) | $17,794 | $9,724 |
| Standard Deviation (Sample) | $14,461 | $9,206 |
| Standard Deviation (Population) | $14,284 | $9,127 |
Similar Demographics by Householder Income Over 65 years
Demographics Similar to Inupiat by Householder Income Over 65 years
In terms of householder income over 65 years, the demographic groups most similar to Inupiat are Immigrants from Poland ($61,041, a difference of 0.030%), Serbian ($61,087, a difference of 0.040%), Carpatho Rusyn ($61,093, a difference of 0.050%), Irish ($61,097, a difference of 0.060%), and Norwegian ($61,104, a difference of 0.070%).
| Demographics | Rating | Rank | Householder Income Over 65 years |
| Immigrants | North Macedonia | 55.4 /100 | #164 | Average $61,175 |
| Immigrants | Ukraine | 55.1 /100 | #165 | Average $61,163 |
| Immigrants | Eastern Africa | 55.0 /100 | #166 | Average $61,157 |
| Norwegians | 53.6 /100 | #167 | Average $61,104 |
| Irish | 53.4 /100 | #168 | Average $61,097 |
| Carpatho Rusyns | 53.3 /100 | #169 | Average $61,093 |
| Serbians | 53.1 /100 | #170 | Average $61,087 |
| Inupiat | 52.4 /100 | #171 | Average $61,061 |
| Immigrants | Poland | 51.9 /100 | #172 | Average $61,041 |
| Immigrants | Micronesia | 50.8 /100 | #173 | Average $61,000 |
| Luxembourgers | 50.0 /100 | #174 | Average $60,967 |
| Spaniards | 47.3 /100 | #175 | Average $60,866 |
| Spanish | 45.5 /100 | #176 | Average $60,795 |
| Alaska Natives | 44.3 /100 | #177 | Average $60,748 |
| Yup'ik | 43.7 /100 | #178 | Average $60,727 |
Demographics Similar to Pennsylvania Germans by Householder Income Over 65 years
In terms of householder income over 65 years, the demographic groups most similar to Pennsylvania Germans are Pueblo ($52,930, a difference of 0.080%), Ute ($52,949, a difference of 0.11%), Hispanic or Latino ($52,832, a difference of 0.11%), Immigrants from Mexico ($52,801, a difference of 0.17%), and Choctaw ($53,060, a difference of 0.32%).
| Demographics | Rating | Rank | Householder Income Over 65 years |
| Ottawa | 0.0 /100 | #299 | Tragic $53,217 |
| Immigrants | Bahamas | 0.0 /100 | #300 | Tragic $53,174 |
| Yuman | 0.0 /100 | #301 | Tragic $53,110 |
| Spanish American Indians | 0.0 /100 | #302 | Tragic $53,077 |
| Choctaw | 0.0 /100 | #303 | Tragic $53,060 |
| Ute | 0.0 /100 | #304 | Tragic $52,949 |
| Pueblo | 0.0 /100 | #305 | Tragic $52,930 |
| Pennsylvania Germans | 0.0 /100 | #306 | Tragic $52,888 |
| Hispanics or Latinos | 0.0 /100 | #307 | Tragic $52,832 |
| Immigrants | Mexico | 0.0 /100 | #308 | Tragic $52,801 |
| Hondurans | 0.0 /100 | #309 | Tragic $52,634 |
| Sioux | 0.0 /100 | #310 | Tragic $52,509 |
| Seminole | 0.0 /100 | #311 | Tragic $52,373 |
| Immigrants | Azores | 0.0 /100 | #312 | Tragic $52,121 |
| Immigrants | Nicaragua | 0.0 /100 | #313 | Tragic $52,085 |