Seminole vs Pennsylvania German Householder Income Over 65 years
COMPARE
Seminole
Pennsylvania German
Householder Income Over 65 years
Householder Income Over 65 years Comparison
Seminole
Pennsylvania Germans
$52,373
HOUSEHOLDER INCOME OVER 65 YEARS
0.0/ 100
METRIC RATING
311th/ 347
METRIC RANK
$52,888
HOUSEHOLDER INCOME OVER 65 YEARS
0.0/ 100
METRIC RATING
306th/ 347
METRIC RANK
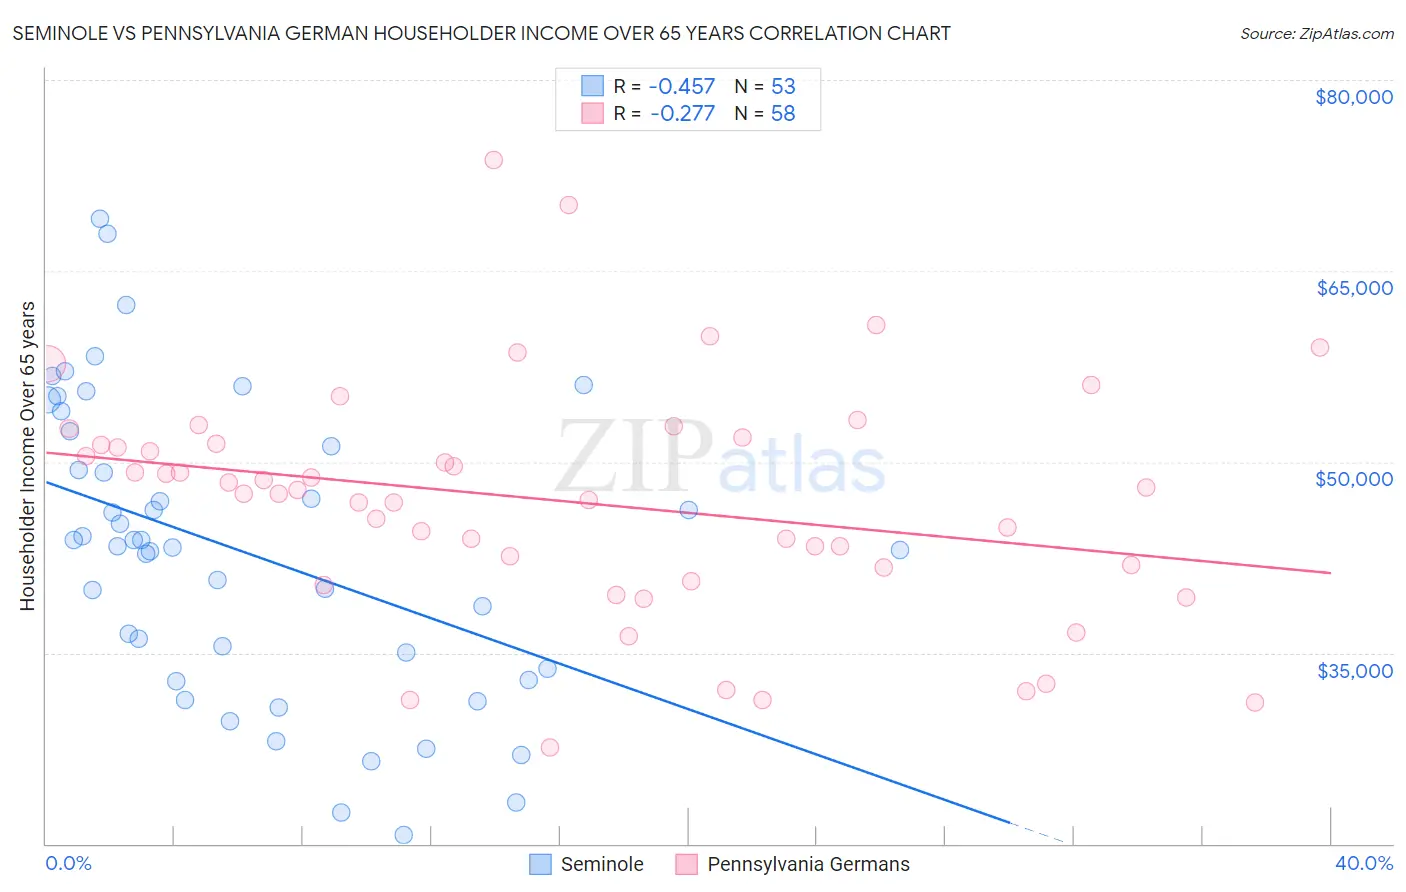
Seminole vs Pennsylvania German Householder Income Over 65 years Correlation Chart
The statistical analysis conducted on geographies consisting of 118,149,941 people shows a moderate negative correlation between the proportion of Seminole and household income with householder over the age of 65 in the United States with a correlation coefficient (R) of -0.457 and weighted average of $52,373. Similarly, the statistical analysis conducted on geographies consisting of 233,753,814 people shows a weak negative correlation between the proportion of Pennsylvania Germans and household income with householder over the age of 65 in the United States with a correlation coefficient (R) of -0.277 and weighted average of $52,888, a difference of 0.98%.
Householder Income Over 65 years Correlation Summary
| Measurement | Seminole | Pennsylvania German |
| Minimum | $20,714 | $27,515 |
| Maximum | $69,068 | $73,750 |
| Range | $48,354 | $46,235 |
| Mean | $42,904 | $46,892 |
| Median | $43,396 | $47,645 |
| Interquartile 25% (IQ1) | $33,309 | $41,667 |
| Interquartile 75% (IQ3) | $51,804 | $51,391 |
| Interquartile Range (IQR) | $18,495 | $9,724 |
| Standard Deviation (Sample) | $11,569 | $9,206 |
| Standard Deviation (Population) | $11,460 | $9,127 |
Demographics Similar to Seminole and Pennsylvania Germans by Householder Income Over 65 years
In terms of householder income over 65 years, the demographic groups most similar to Seminole are Sioux ($52,509, a difference of 0.26%), Immigrants from the Azores ($52,121, a difference of 0.48%), Honduran ($52,634, a difference of 0.50%), Immigrants from Nicaragua ($52,085, a difference of 0.55%), and Native/Alaskan ($52,081, a difference of 0.56%). Similarly, the demographic groups most similar to Pennsylvania Germans are Pueblo ($52,930, a difference of 0.080%), Ute ($52,949, a difference of 0.11%), Hispanic or Latino ($52,832, a difference of 0.11%), Immigrants from Mexico ($52,801, a difference of 0.17%), and Choctaw ($53,060, a difference of 0.32%).
| Demographics | Rating | Rank | Householder Income Over 65 years |
| Central American Indians | 0.0 /100 | #298 | Tragic $53,232 |
| Ottawa | 0.0 /100 | #299 | Tragic $53,217 |
| Immigrants | Bahamas | 0.0 /100 | #300 | Tragic $53,174 |
| Yuman | 0.0 /100 | #301 | Tragic $53,110 |
| Spanish American Indians | 0.0 /100 | #302 | Tragic $53,077 |
| Choctaw | 0.0 /100 | #303 | Tragic $53,060 |
| Ute | 0.0 /100 | #304 | Tragic $52,949 |
| Pueblo | 0.0 /100 | #305 | Tragic $52,930 |
| Pennsylvania Germans | 0.0 /100 | #306 | Tragic $52,888 |
| Hispanics or Latinos | 0.0 /100 | #307 | Tragic $52,832 |
| Immigrants | Mexico | 0.0 /100 | #308 | Tragic $52,801 |
| Hondurans | 0.0 /100 | #309 | Tragic $52,634 |
| Sioux | 0.0 /100 | #310 | Tragic $52,509 |
| Seminole | 0.0 /100 | #311 | Tragic $52,373 |
| Immigrants | Azores | 0.0 /100 | #312 | Tragic $52,121 |
| Immigrants | Nicaragua | 0.0 /100 | #313 | Tragic $52,085 |
| Natives/Alaskans | 0.0 /100 | #314 | Tragic $52,081 |
| U.S. Virgin Islanders | 0.0 /100 | #315 | Tragic $52,072 |
| Creek | 0.0 /100 | #316 | Tragic $51,949 |
| Immigrants | St. Vincent and the Grenadines | 0.0 /100 | #317 | Tragic $51,922 |
| Haitians | 0.0 /100 | #318 | Tragic $51,912 |