Scotch-Irish vs Pennsylvania German Single Female Poverty
COMPARE
Scotch-Irish
Pennsylvania German
Single Female Poverty
Single Female Poverty Comparison
Scotch-Irish
Pennsylvania Germans
22.9%
SINGLE FEMALE POVERTY
0.3/ 100
METRIC RATING
263rd/ 347
METRIC RANK
23.6%
SINGLE FEMALE POVERTY
0.0/ 100
METRIC RATING
277th/ 347
METRIC RANK
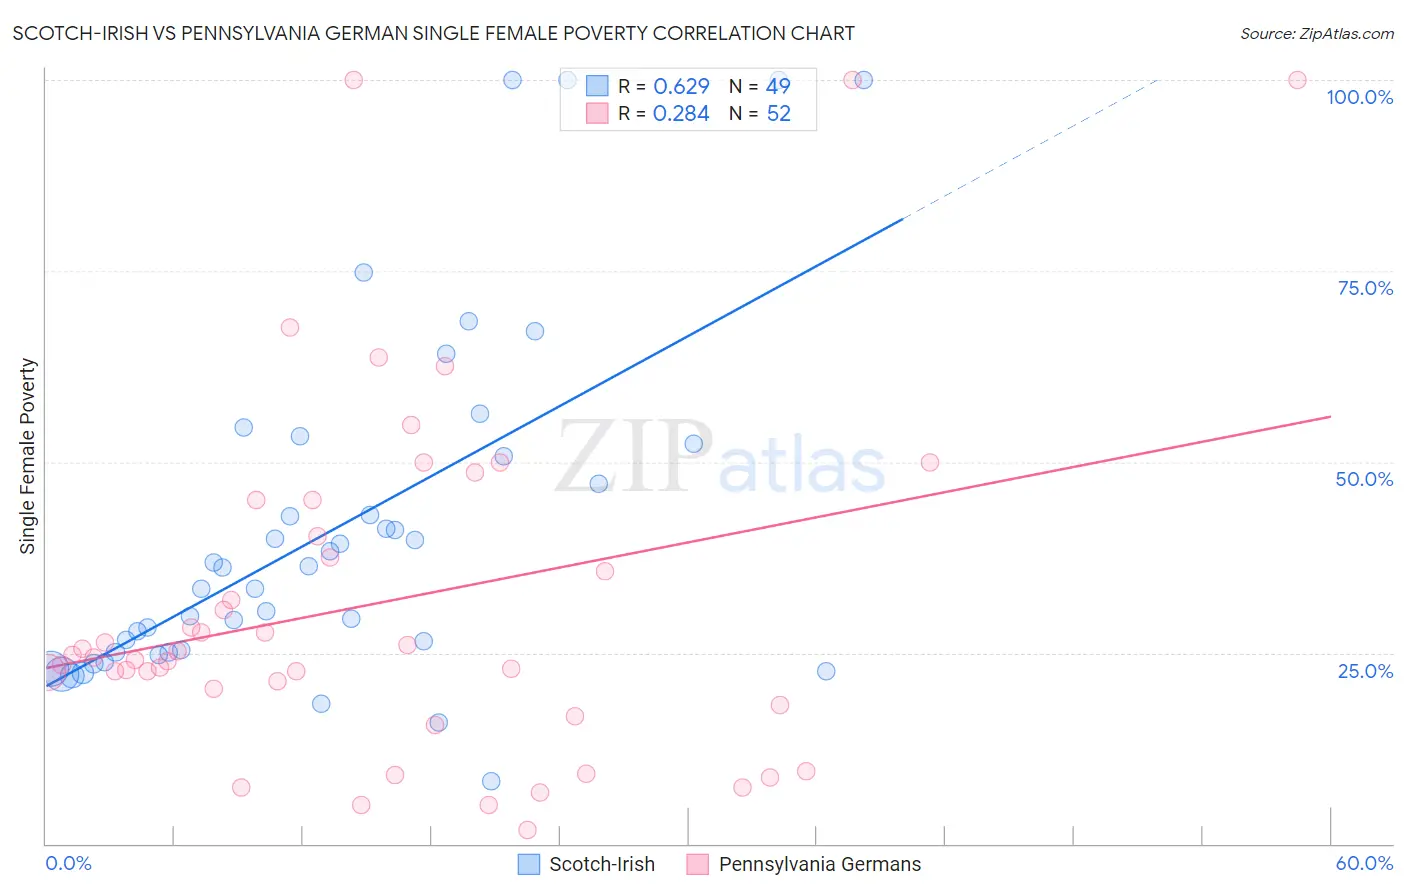
Scotch-Irish vs Pennsylvania German Single Female Poverty Correlation Chart
The statistical analysis conducted on geographies consisting of 531,342,644 people shows a significant positive correlation between the proportion of Scotch-Irish and poverty level among single females in the United States with a correlation coefficient (R) of 0.629 and weighted average of 22.9%. Similarly, the statistical analysis conducted on geographies consisting of 231,066,228 people shows a weak positive correlation between the proportion of Pennsylvania Germans and poverty level among single females in the United States with a correlation coefficient (R) of 0.284 and weighted average of 23.6%, a difference of 2.8%.
Single Female Poverty Correlation Summary
| Measurement | Scotch-Irish | Pennsylvania German |
| Minimum | 8.1% | 1.8% |
| Maximum | 100.0% | 100.0% |
| Range | 91.9% | 98.2% |
| Mean | 41.2% | 31.6% |
| Median | 36.1% | 24.5% |
| Interquartile 25% (IQ1) | 25.0% | 19.2% |
| Interquartile 75% (IQ3) | 51.6% | 42.6% |
| Interquartile Range (IQR) | 26.6% | 23.4% |
| Standard Deviation (Sample) | 22.8% | 23.3% |
| Standard Deviation (Population) | 22.5% | 23.1% |
Demographics Similar to Scotch-Irish and Pennsylvania Germans by Single Female Poverty
In terms of single female poverty, the demographic groups most similar to Scotch-Irish are Immigrants from Laos (22.9%, a difference of 0.070%), Central American (23.0%, a difference of 0.24%), British West Indian (22.8%, a difference of 0.41%), Immigrants from Micronesia (23.0%, a difference of 0.45%), and Senegalese (23.0%, a difference of 0.51%). Similarly, the demographic groups most similar to Pennsylvania Germans are Nonimmigrants (23.6%, a difference of 0.080%), Alaskan Athabascan (23.6%, a difference of 0.11%), Immigrants from the Azores (23.5%, a difference of 0.15%), Immigrants from Latin America (23.7%, a difference of 0.60%), and Mexican American Indian (23.4%, a difference of 0.94%).
| Demographics | Rating | Rank | Single Female Poverty |
| Celtics | 0.5 /100 | #260 | Tragic 22.7% |
| Immigrants | Cabo Verde | 0.4 /100 | #261 | Tragic 22.8% |
| British West Indians | 0.4 /100 | #262 | Tragic 22.8% |
| Scotch-Irish | 0.3 /100 | #263 | Tragic 22.9% |
| Immigrants | Laos | 0.3 /100 | #264 | Tragic 22.9% |
| Central Americans | 0.2 /100 | #265 | Tragic 23.0% |
| Immigrants | Micronesia | 0.2 /100 | #266 | Tragic 23.0% |
| Senegalese | 0.2 /100 | #267 | Tragic 23.0% |
| Fijians | 0.2 /100 | #268 | Tragic 23.1% |
| Hmong | 0.2 /100 | #269 | Tragic 23.1% |
| Inupiat | 0.2 /100 | #270 | Tragic 23.1% |
| Sub-Saharan Africans | 0.1 /100 | #271 | Tragic 23.2% |
| Immigrants | Senegal | 0.1 /100 | #272 | Tragic 23.2% |
| Alaska Natives | 0.1 /100 | #273 | Tragic 23.3% |
| Marshallese | 0.1 /100 | #274 | Tragic 23.3% |
| Mexican American Indians | 0.1 /100 | #275 | Tragic 23.4% |
| Immigrants | Azores | 0.0 /100 | #276 | Tragic 23.5% |
| Pennsylvania Germans | 0.0 /100 | #277 | Tragic 23.6% |
| Immigrants | Nonimmigrants | 0.0 /100 | #278 | Tragic 23.6% |
| Alaskan Athabascans | 0.0 /100 | #279 | Tragic 23.6% |
| Immigrants | Latin America | 0.0 /100 | #280 | Tragic 23.7% |