Pima vs Immigrants from Bangladesh Median Female Earnings
COMPARE
Pima
Immigrants from Bangladesh
Median Female Earnings
Median Female Earnings Comparison
Pima
Immigrants from Bangladesh
$35,326
MEDIAN FEMALE EARNINGS
0.0/ 100
METRIC RATING
301st/ 347
METRIC RANK
$39,910
MEDIAN FEMALE EARNINGS
60.8/ 100
METRIC RATING
165th/ 347
METRIC RANK
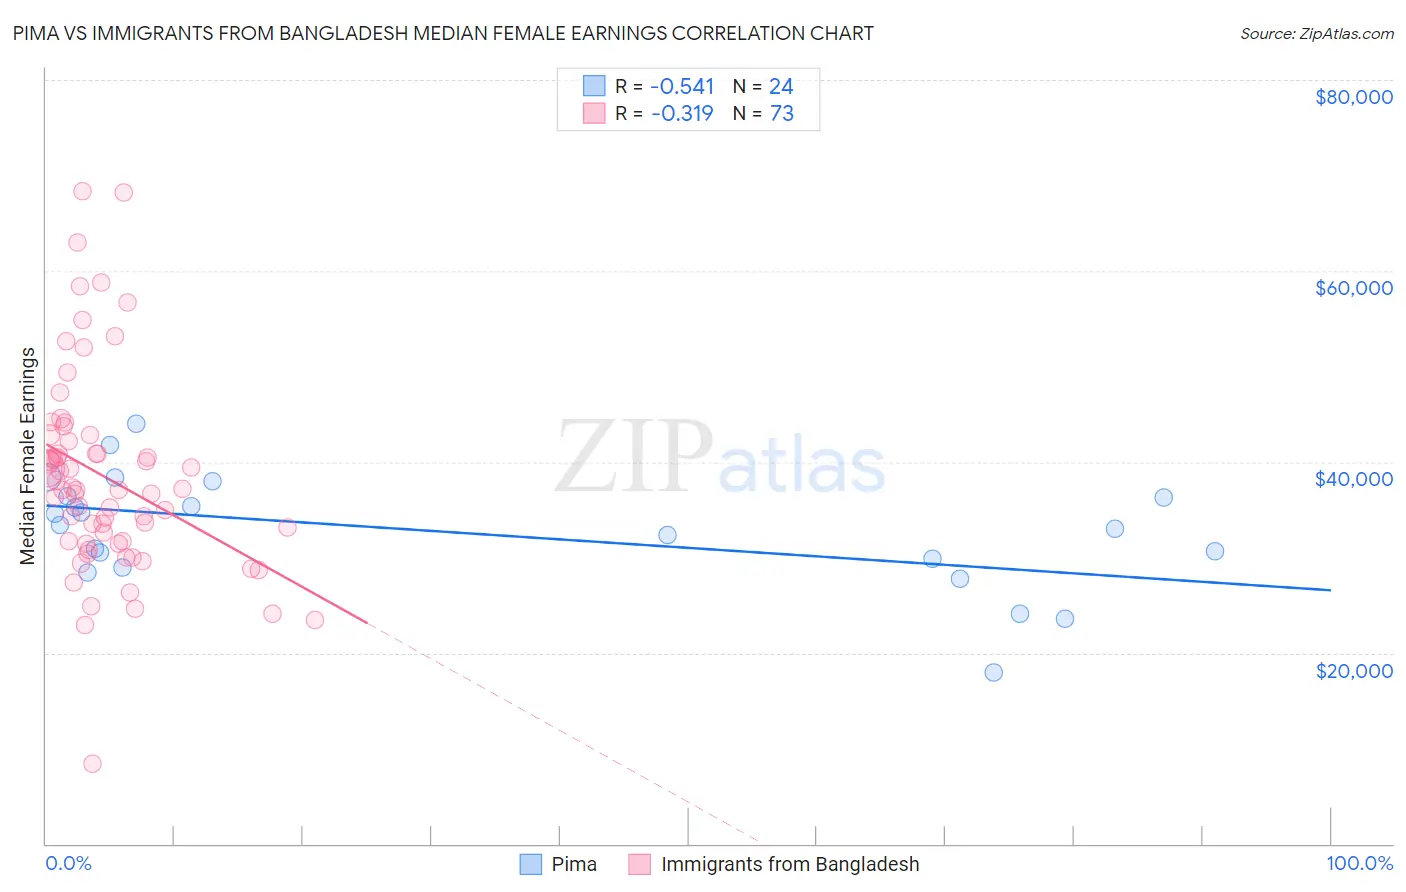
Pima vs Immigrants from Bangladesh Median Female Earnings Correlation Chart
The statistical analysis conducted on geographies consisting of 61,524,471 people shows a substantial negative correlation between the proportion of Pima and median female earnings in the United States with a correlation coefficient (R) of -0.541 and weighted average of $35,326. Similarly, the statistical analysis conducted on geographies consisting of 203,663,307 people shows a mild negative correlation between the proportion of Immigrants from Bangladesh and median female earnings in the United States with a correlation coefficient (R) of -0.319 and weighted average of $39,910, a difference of 13.0%.
Median Female Earnings Correlation Summary
| Measurement | Pima | Immigrants from Bangladesh |
| Minimum | $17,917 | $8,380 |
| Maximum | $43,952 | $68,327 |
| Range | $26,035 | $59,947 |
| Mean | $32,676 | $38,386 |
| Median | $33,171 | $37,048 |
| Interquartile 25% (IQ1) | $29,398 | $31,570 |
| Interquartile 75% (IQ3) | $36,333 | $42,477 |
| Interquartile Range (IQR) | $6,935 | $10,907 |
| Standard Deviation (Sample) | $5,900 | $10,596 |
| Standard Deviation (Population) | $5,776 | $10,523 |
Similar Demographics by Median Female Earnings
Demographics Similar to Pima by Median Female Earnings
In terms of median female earnings, the demographic groups most similar to Pima are Black/African American ($35,315, a difference of 0.030%), Immigrants from Latin America ($35,307, a difference of 0.050%), Yuman ($35,377, a difference of 0.14%), Crow ($35,266, a difference of 0.17%), and Immigrants from Guatemala ($35,444, a difference of 0.33%).
| Demographics | Rating | Rank | Median Female Earnings |
| Cheyenne | 0.0 /100 | #294 | Tragic $35,673 |
| Comanche | 0.0 /100 | #295 | Tragic $35,661 |
| Mexican American Indians | 0.0 /100 | #296 | Tragic $35,629 |
| Hmong | 0.0 /100 | #297 | Tragic $35,498 |
| Immigrants | Micronesia | 0.0 /100 | #298 | Tragic $35,477 |
| Immigrants | Guatemala | 0.0 /100 | #299 | Tragic $35,444 |
| Yuman | 0.0 /100 | #300 | Tragic $35,377 |
| Pima | 0.0 /100 | #301 | Tragic $35,326 |
| Blacks/African Americans | 0.0 /100 | #302 | Tragic $35,315 |
| Immigrants | Latin America | 0.0 /100 | #303 | Tragic $35,307 |
| Crow | 0.0 /100 | #304 | Tragic $35,266 |
| Bahamians | 0.0 /100 | #305 | Tragic $35,125 |
| Fijians | 0.0 /100 | #306 | Tragic $35,114 |
| Sioux | 0.0 /100 | #307 | Tragic $35,063 |
| Immigrants | Bahamas | 0.0 /100 | #308 | Tragic $35,027 |
Demographics Similar to Immigrants from Bangladesh by Median Female Earnings
In terms of median female earnings, the demographic groups most similar to Immigrants from Bangladesh are Immigrants from Ghana ($39,894, a difference of 0.040%), Luxembourger ($39,891, a difference of 0.050%), Immigrants from Peru ($39,871, a difference of 0.10%), Immigrants from Saudi Arabia ($39,952, a difference of 0.11%), and Kenyan ($39,860, a difference of 0.12%).
| Demographics | Rating | Rank | Median Female Earnings |
| Immigrants | Senegal | 72.2 /100 | #158 | Good $40,157 |
| Immigrants | Vietnam | 72.0 /100 | #159 | Good $40,153 |
| Inupiat | 68.9 /100 | #160 | Good $40,080 |
| Alsatians | 68.0 /100 | #161 | Good $40,060 |
| South American Indians | 66.1 /100 | #162 | Good $40,019 |
| Lebanese | 65.5 /100 | #163 | Good $40,006 |
| Immigrants | Saudi Arabia | 62.9 /100 | #164 | Good $39,952 |
| Immigrants | Bangladesh | 60.8 /100 | #165 | Good $39,910 |
| Immigrants | Ghana | 60.0 /100 | #166 | Good $39,894 |
| Luxembourgers | 59.9 /100 | #167 | Average $39,891 |
| Immigrants | Peru | 58.9 /100 | #168 | Average $39,871 |
| Kenyans | 58.4 /100 | #169 | Average $39,860 |
| Slovenes | 56.2 /100 | #170 | Average $39,817 |
| Immigrants | Portugal | 54.7 /100 | #171 | Average $39,788 |
| British | 53.8 /100 | #172 | Average $39,772 |