Pima vs Immigrants from Zaire Median Female Earnings
COMPARE
Pima
Immigrants from Zaire
Median Female Earnings
Median Female Earnings Comparison
Pima
Immigrants from Zaire
$35,326
MEDIAN FEMALE EARNINGS
0.0/ 100
METRIC RATING
301st/ 347
METRIC RANK
$36,017
MEDIAN FEMALE EARNINGS
0.0/ 100
METRIC RATING
288th/ 347
METRIC RANK
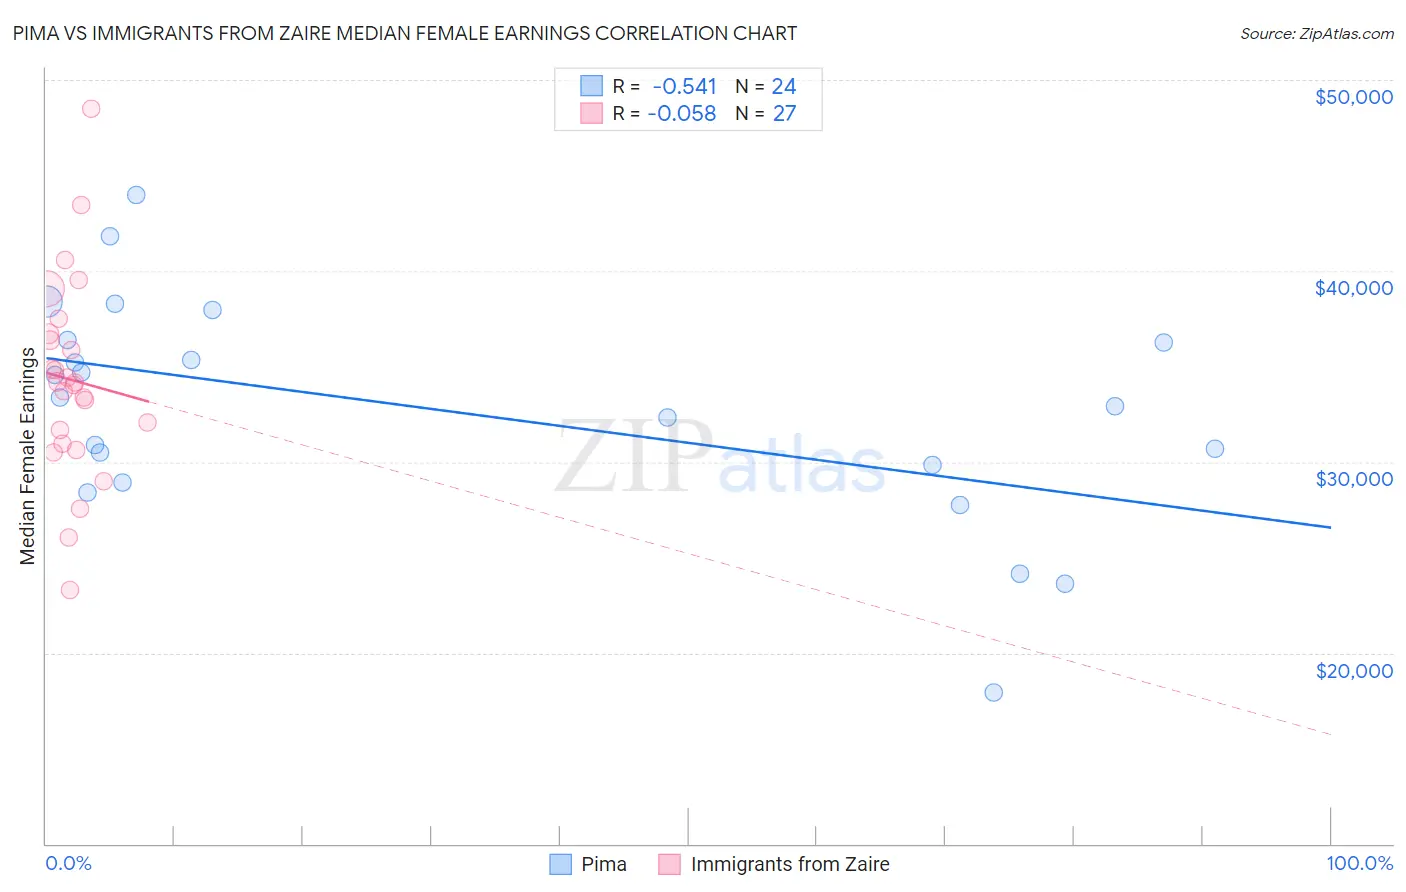
Pima vs Immigrants from Zaire Median Female Earnings Correlation Chart
The statistical analysis conducted on geographies consisting of 61,524,471 people shows a substantial negative correlation between the proportion of Pima and median female earnings in the United States with a correlation coefficient (R) of -0.541 and weighted average of $35,326. Similarly, the statistical analysis conducted on geographies consisting of 107,241,232 people shows a slight negative correlation between the proportion of Immigrants from Zaire and median female earnings in the United States with a correlation coefficient (R) of -0.058 and weighted average of $36,017, a difference of 2.0%.
Median Female Earnings Correlation Summary
| Measurement | Pima | Immigrants from Zaire |
| Minimum | $17,917 | $23,286 |
| Maximum | $43,952 | $48,487 |
| Range | $26,035 | $25,201 |
| Mean | $32,676 | $34,296 |
| Median | $33,171 | $34,189 |
| Interquartile 25% (IQ1) | $29,398 | $30,969 |
| Interquartile 75% (IQ3) | $36,333 | $36,705 |
| Interquartile Range (IQR) | $6,935 | $5,736 |
| Standard Deviation (Sample) | $5,900 | $5,243 |
| Standard Deviation (Population) | $5,776 | $5,145 |
Demographics Similar to Pima and Immigrants from Zaire by Median Female Earnings
In terms of median female earnings, the demographic groups most similar to Pima are Black/African American ($35,315, a difference of 0.030%), Immigrants from Latin America ($35,307, a difference of 0.050%), Yuman ($35,377, a difference of 0.14%), Crow ($35,266, a difference of 0.17%), and Immigrants from Guatemala ($35,444, a difference of 0.33%). Similarly, the demographic groups most similar to Immigrants from Zaire are Immigrants from Nicaragua ($36,023, a difference of 0.020%), Osage ($36,034, a difference of 0.050%), Paiute ($36,056, a difference of 0.11%), Bangladeshi ($35,960, a difference of 0.16%), and Central American Indian ($35,930, a difference of 0.24%).
| Demographics | Rating | Rank | Median Female Earnings |
| Indonesians | 0.1 /100 | #284 | Tragic $36,140 |
| Paiute | 0.1 /100 | #285 | Tragic $36,056 |
| Osage | 0.0 /100 | #286 | Tragic $36,034 |
| Immigrants | Nicaragua | 0.0 /100 | #287 | Tragic $36,023 |
| Immigrants | Zaire | 0.0 /100 | #288 | Tragic $36,017 |
| Bangladeshis | 0.0 /100 | #289 | Tragic $35,960 |
| Central American Indians | 0.0 /100 | #290 | Tragic $35,930 |
| Blackfeet | 0.0 /100 | #291 | Tragic $35,864 |
| Americans | 0.0 /100 | #292 | Tragic $35,777 |
| Guatemalans | 0.0 /100 | #293 | Tragic $35,695 |
| Cheyenne | 0.0 /100 | #294 | Tragic $35,673 |
| Comanche | 0.0 /100 | #295 | Tragic $35,661 |
| Mexican American Indians | 0.0 /100 | #296 | Tragic $35,629 |
| Hmong | 0.0 /100 | #297 | Tragic $35,498 |
| Immigrants | Micronesia | 0.0 /100 | #298 | Tragic $35,477 |
| Immigrants | Guatemala | 0.0 /100 | #299 | Tragic $35,444 |
| Yuman | 0.0 /100 | #300 | Tragic $35,377 |
| Pima | 0.0 /100 | #301 | Tragic $35,326 |
| Blacks/African Americans | 0.0 /100 | #302 | Tragic $35,315 |
| Immigrants | Latin America | 0.0 /100 | #303 | Tragic $35,307 |
| Crow | 0.0 /100 | #304 | Tragic $35,266 |