Pima vs Immigrants from Western Africa Median Female Earnings
COMPARE
Pima
Immigrants from Western Africa
Median Female Earnings
Median Female Earnings Comparison
Pima
Immigrants from Western Africa
$35,326
MEDIAN FEMALE EARNINGS
0.0/ 100
METRIC RATING
301st/ 347
METRIC RANK
$39,351
MEDIAN FEMALE EARNINGS
32.7/ 100
METRIC RATING
191st/ 347
METRIC RANK
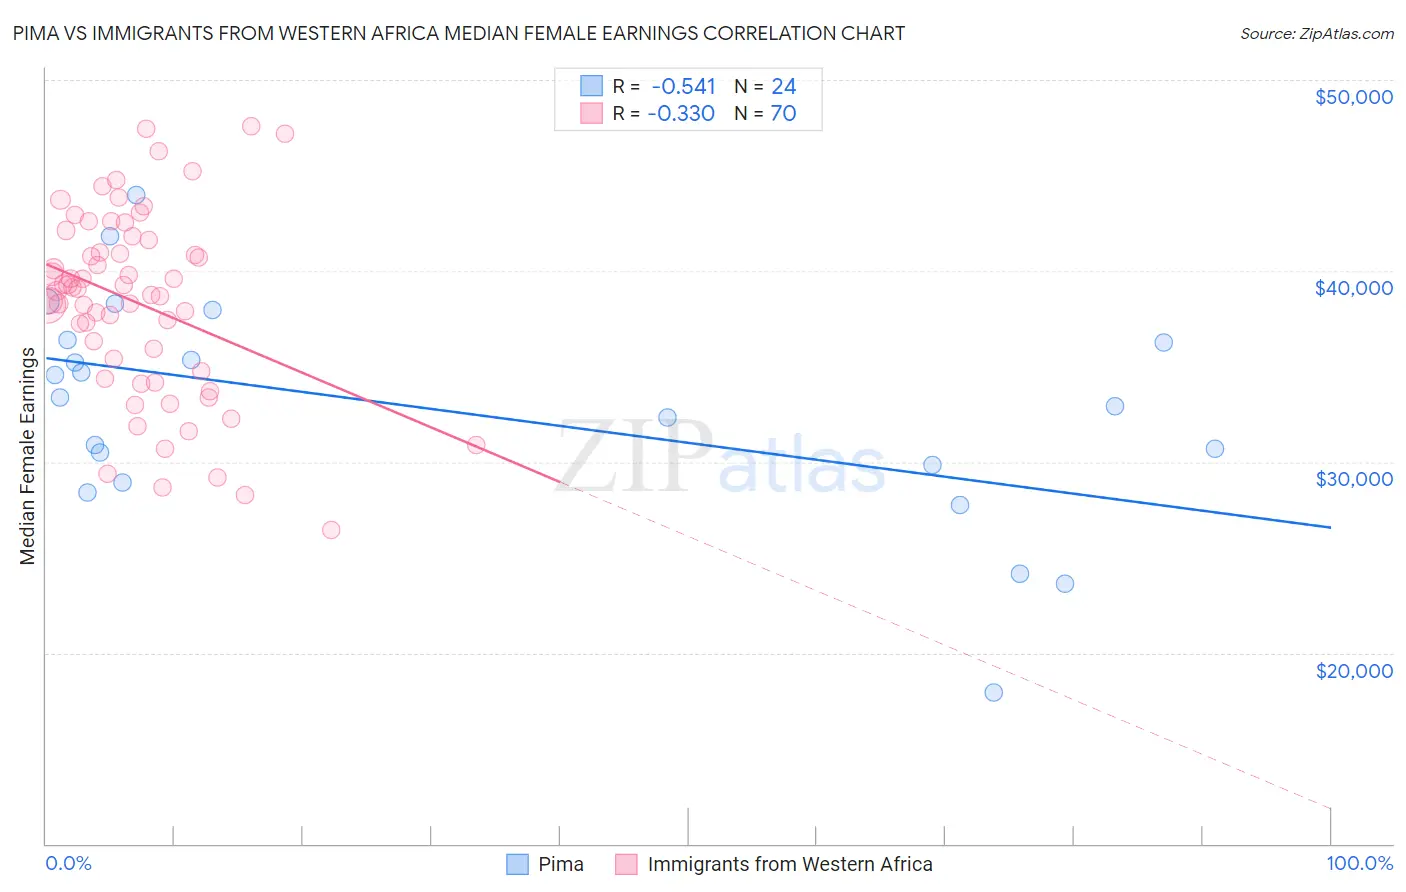
Pima vs Immigrants from Western Africa Median Female Earnings Correlation Chart
The statistical analysis conducted on geographies consisting of 61,524,471 people shows a substantial negative correlation between the proportion of Pima and median female earnings in the United States with a correlation coefficient (R) of -0.541 and weighted average of $35,326. Similarly, the statistical analysis conducted on geographies consisting of 357,790,010 people shows a mild negative correlation between the proportion of Immigrants from Western Africa and median female earnings in the United States with a correlation coefficient (R) of -0.330 and weighted average of $39,351, a difference of 11.4%.
Median Female Earnings Correlation Summary
| Measurement | Pima | Immigrants from Western Africa |
| Minimum | $17,917 | $26,446 |
| Maximum | $43,952 | $47,567 |
| Range | $26,035 | $21,121 |
| Mean | $32,676 | $38,325 |
| Median | $33,171 | $39,007 |
| Interquartile 25% (IQ1) | $29,398 | $34,756 |
| Interquartile 75% (IQ3) | $36,333 | $41,620 |
| Interquartile Range (IQR) | $6,935 | $6,864 |
| Standard Deviation (Sample) | $5,900 | $4,866 |
| Standard Deviation (Population) | $5,776 | $4,831 |
Similar Demographics by Median Female Earnings
Demographics Similar to Pima by Median Female Earnings
In terms of median female earnings, the demographic groups most similar to Pima are Black/African American ($35,315, a difference of 0.030%), Immigrants from Latin America ($35,307, a difference of 0.050%), Yuman ($35,377, a difference of 0.14%), Crow ($35,266, a difference of 0.17%), and Immigrants from Guatemala ($35,444, a difference of 0.33%).
| Demographics | Rating | Rank | Median Female Earnings |
| Cheyenne | 0.0 /100 | #294 | Tragic $35,673 |
| Comanche | 0.0 /100 | #295 | Tragic $35,661 |
| Mexican American Indians | 0.0 /100 | #296 | Tragic $35,629 |
| Hmong | 0.0 /100 | #297 | Tragic $35,498 |
| Immigrants | Micronesia | 0.0 /100 | #298 | Tragic $35,477 |
| Immigrants | Guatemala | 0.0 /100 | #299 | Tragic $35,444 |
| Yuman | 0.0 /100 | #300 | Tragic $35,377 |
| Pima | 0.0 /100 | #301 | Tragic $35,326 |
| Blacks/African Americans | 0.0 /100 | #302 | Tragic $35,315 |
| Immigrants | Latin America | 0.0 /100 | #303 | Tragic $35,307 |
| Crow | 0.0 /100 | #304 | Tragic $35,266 |
| Bahamians | 0.0 /100 | #305 | Tragic $35,125 |
| Fijians | 0.0 /100 | #306 | Tragic $35,114 |
| Sioux | 0.0 /100 | #307 | Tragic $35,063 |
| Immigrants | Bahamas | 0.0 /100 | #308 | Tragic $35,027 |
Demographics Similar to Immigrants from Western Africa by Median Female Earnings
In terms of median female earnings, the demographic groups most similar to Immigrants from Western Africa are Puget Sound Salish ($39,376, a difference of 0.060%), Immigrants ($39,328, a difference of 0.060%), Senegalese ($39,384, a difference of 0.080%), Immigrants from Nigeria ($39,294, a difference of 0.14%), and Irish ($39,291, a difference of 0.15%).
| Demographics | Rating | Rank | Median Female Earnings |
| Europeans | 37.7 /100 | #184 | Fair $39,457 |
| Immigrants | West Indies | 36.9 /100 | #185 | Fair $39,441 |
| Colombians | 36.9 /100 | #186 | Fair $39,439 |
| Swedes | 36.0 /100 | #187 | Fair $39,421 |
| Bermudans | 35.9 /100 | #188 | Fair $39,418 |
| Senegalese | 34.2 /100 | #189 | Fair $39,384 |
| Puget Sound Salish | 33.9 /100 | #190 | Fair $39,376 |
| Immigrants | Western Africa | 32.7 /100 | #191 | Fair $39,351 |
| Immigrants | Immigrants | 31.7 /100 | #192 | Fair $39,328 |
| Immigrants | Nigeria | 30.2 /100 | #193 | Fair $39,294 |
| Irish | 30.0 /100 | #194 | Fair $39,291 |
| Uruguayans | 27.3 /100 | #195 | Fair $39,228 |
| Immigrants | Costa Rica | 25.6 /100 | #196 | Fair $39,186 |
| Assyrians/Chaldeans/Syriacs | 24.6 /100 | #197 | Fair $39,159 |
| Ecuadorians | 23.0 /100 | #198 | Fair $39,117 |