Scandinavian vs Immigrants from Bangladesh Median Female Earnings
COMPARE
Scandinavian
Immigrants from Bangladesh
Median Female Earnings
Median Female Earnings Comparison
Scandinavians
Immigrants from Bangladesh
$38,306
MEDIAN FEMALE EARNINGS
5.2/ 100
METRIC RATING
232nd/ 347
METRIC RANK
$39,910
MEDIAN FEMALE EARNINGS
60.8/ 100
METRIC RATING
165th/ 347
METRIC RANK
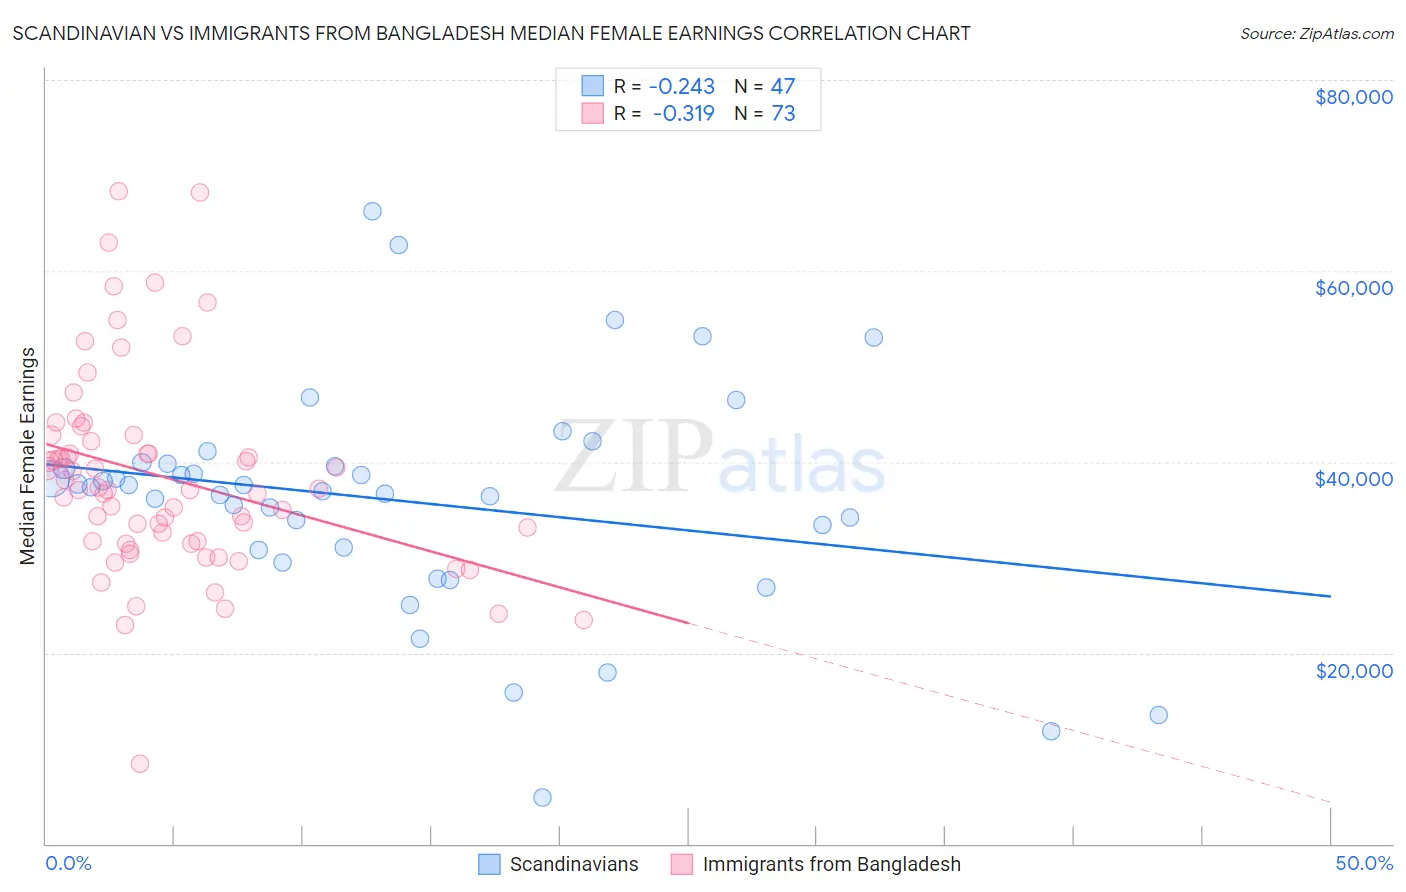
Scandinavian vs Immigrants from Bangladesh Median Female Earnings Correlation Chart
The statistical analysis conducted on geographies consisting of 472,085,070 people shows a weak negative correlation between the proportion of Scandinavians and median female earnings in the United States with a correlation coefficient (R) of -0.243 and weighted average of $38,306. Similarly, the statistical analysis conducted on geographies consisting of 203,663,307 people shows a mild negative correlation between the proportion of Immigrants from Bangladesh and median female earnings in the United States with a correlation coefficient (R) of -0.319 and weighted average of $39,910, a difference of 4.2%.
Median Female Earnings Correlation Summary
| Measurement | Scandinavian | Immigrants from Bangladesh |
| Minimum | $4,824 | $8,380 |
| Maximum | $66,207 | $68,327 |
| Range | $61,383 | $59,947 |
| Mean | $35,901 | $38,386 |
| Median | $37,378 | $37,048 |
| Interquartile 25% (IQ1) | $30,708 | $31,570 |
| Interquartile 75% (IQ3) | $39,798 | $42,477 |
| Interquartile Range (IQR) | $9,090 | $10,907 |
| Standard Deviation (Sample) | $11,858 | $10,596 |
| Standard Deviation (Population) | $11,731 | $10,523 |
Similar Demographics by Median Female Earnings
Demographics Similar to Scandinavians by Median Female Earnings
In terms of median female earnings, the demographic groups most similar to Scandinavians are Tongan ($38,288, a difference of 0.050%), Celtic ($38,283, a difference of 0.060%), Somali ($38,333, a difference of 0.070%), Basque ($38,352, a difference of 0.12%), and Belgian ($38,382, a difference of 0.20%).
| Demographics | Rating | Rank | Median Female Earnings |
| French | 7.0 /100 | #225 | Tragic $38,457 |
| French Canadians | 6.8 /100 | #226 | Tragic $38,436 |
| Scottish | 6.3 /100 | #227 | Tragic $38,397 |
| Sub-Saharan Africans | 6.2 /100 | #228 | Tragic $38,391 |
| Belgians | 6.1 /100 | #229 | Tragic $38,382 |
| Basques | 5.7 /100 | #230 | Tragic $38,352 |
| Somalis | 5.5 /100 | #231 | Tragic $38,333 |
| Scandinavians | 5.2 /100 | #232 | Tragic $38,306 |
| Tongans | 5.1 /100 | #233 | Tragic $38,288 |
| Celtics | 5.0 /100 | #234 | Tragic $38,283 |
| Sudanese | 4.4 /100 | #235 | Tragic $38,215 |
| Liberians | 4.4 /100 | #236 | Tragic $38,215 |
| Immigrants | Cabo Verde | 4.3 /100 | #237 | Tragic $38,208 |
| Alaska Natives | 4.3 /100 | #238 | Tragic $38,202 |
| English | 4.2 /100 | #239 | Tragic $38,196 |
Demographics Similar to Immigrants from Bangladesh by Median Female Earnings
In terms of median female earnings, the demographic groups most similar to Immigrants from Bangladesh are Immigrants from Ghana ($39,894, a difference of 0.040%), Luxembourger ($39,891, a difference of 0.050%), Immigrants from Peru ($39,871, a difference of 0.10%), Immigrants from Saudi Arabia ($39,952, a difference of 0.11%), and Kenyan ($39,860, a difference of 0.12%).
| Demographics | Rating | Rank | Median Female Earnings |
| Immigrants | Senegal | 72.2 /100 | #158 | Good $40,157 |
| Immigrants | Vietnam | 72.0 /100 | #159 | Good $40,153 |
| Inupiat | 68.9 /100 | #160 | Good $40,080 |
| Alsatians | 68.0 /100 | #161 | Good $40,060 |
| South American Indians | 66.1 /100 | #162 | Good $40,019 |
| Lebanese | 65.5 /100 | #163 | Good $40,006 |
| Immigrants | Saudi Arabia | 62.9 /100 | #164 | Good $39,952 |
| Immigrants | Bangladesh | 60.8 /100 | #165 | Good $39,910 |
| Immigrants | Ghana | 60.0 /100 | #166 | Good $39,894 |
| Luxembourgers | 59.9 /100 | #167 | Average $39,891 |
| Immigrants | Peru | 58.9 /100 | #168 | Average $39,871 |
| Kenyans | 58.4 /100 | #169 | Average $39,860 |
| Slovenes | 56.2 /100 | #170 | Average $39,817 |
| Immigrants | Portugal | 54.7 /100 | #171 | Average $39,788 |
| British | 53.8 /100 | #172 | Average $39,772 |