Pima vs Immigrants from England Median Female Earnings
COMPARE
Pima
Immigrants from England
Median Female Earnings
Median Female Earnings Comparison
Pima
Immigrants from England
$35,326
MEDIAN FEMALE EARNINGS
0.0/ 100
METRIC RATING
301st/ 347
METRIC RANK
$41,277
MEDIAN FEMALE EARNINGS
96.4/ 100
METRIC RATING
114th/ 347
METRIC RANK
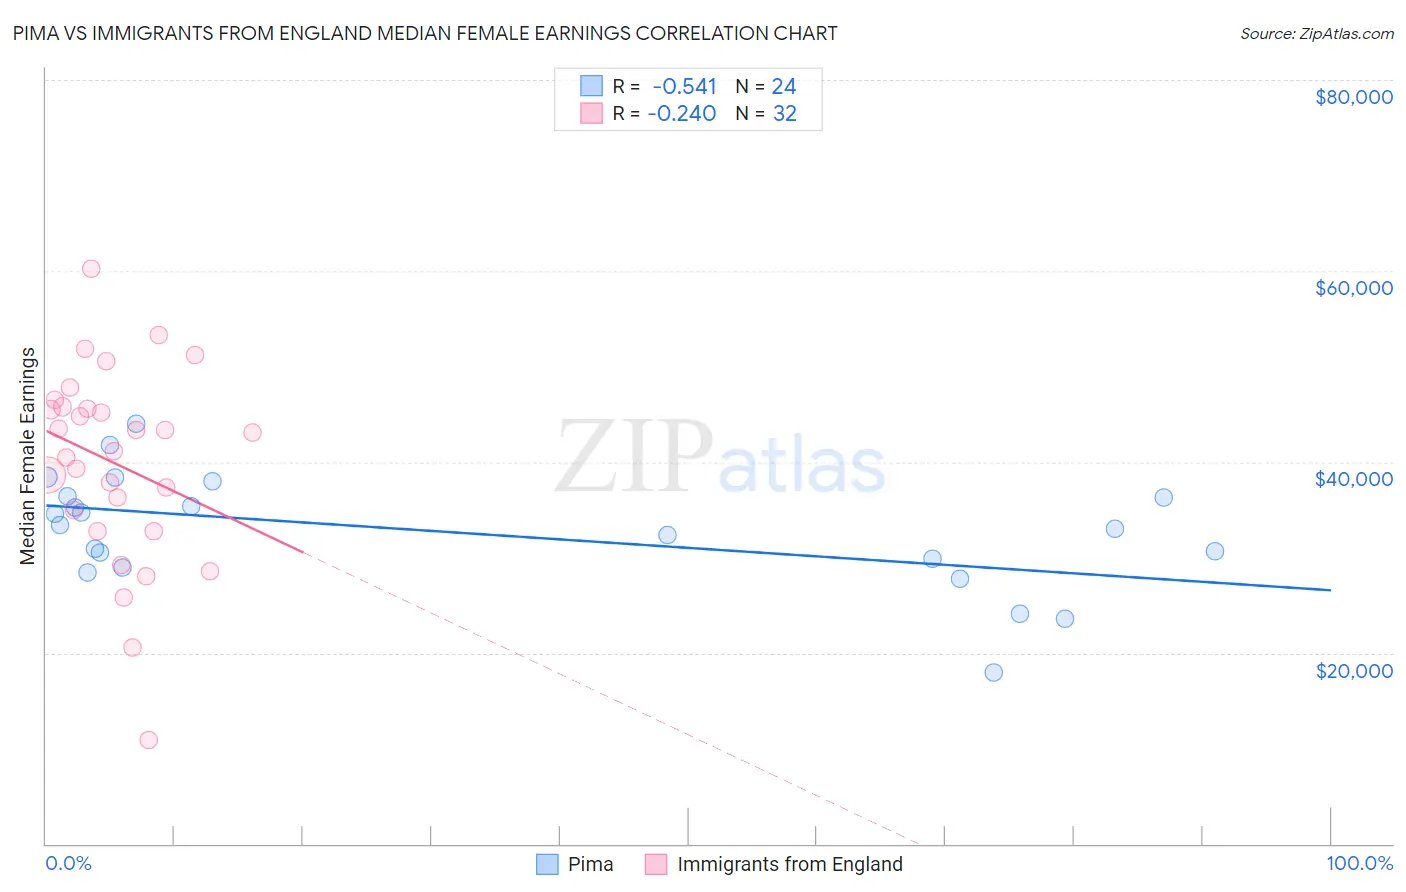
Pima vs Immigrants from England Median Female Earnings Correlation Chart
The statistical analysis conducted on geographies consisting of 61,524,471 people shows a substantial negative correlation between the proportion of Pima and median female earnings in the United States with a correlation coefficient (R) of -0.541 and weighted average of $35,326. Similarly, the statistical analysis conducted on geographies consisting of 391,639,302 people shows a weak negative correlation between the proportion of Immigrants from England and median female earnings in the United States with a correlation coefficient (R) of -0.240 and weighted average of $41,277, a difference of 16.9%.
Median Female Earnings Correlation Summary
| Measurement | Pima | Immigrants from England |
| Minimum | $17,917 | $10,833 |
| Maximum | $43,952 | $60,183 |
| Range | $26,035 | $49,350 |
| Mean | $32,676 | $39,877 |
| Median | $33,171 | $42,129 |
| Interquartile 25% (IQ1) | $29,398 | $33,842 |
| Interquartile 75% (IQ3) | $36,333 | $45,694 |
| Interquartile Range (IQR) | $6,935 | $11,853 |
| Standard Deviation (Sample) | $5,900 | $10,217 |
| Standard Deviation (Population) | $5,776 | $10,056 |
Similar Demographics by Median Female Earnings
Demographics Similar to Pima by Median Female Earnings
In terms of median female earnings, the demographic groups most similar to Pima are Black/African American ($35,315, a difference of 0.030%), Immigrants from Latin America ($35,307, a difference of 0.050%), Yuman ($35,377, a difference of 0.14%), Crow ($35,266, a difference of 0.17%), and Immigrants from Guatemala ($35,444, a difference of 0.33%).
| Demographics | Rating | Rank | Median Female Earnings |
| Cheyenne | 0.0 /100 | #294 | Tragic $35,673 |
| Comanche | 0.0 /100 | #295 | Tragic $35,661 |
| Mexican American Indians | 0.0 /100 | #296 | Tragic $35,629 |
| Hmong | 0.0 /100 | #297 | Tragic $35,498 |
| Immigrants | Micronesia | 0.0 /100 | #298 | Tragic $35,477 |
| Immigrants | Guatemala | 0.0 /100 | #299 | Tragic $35,444 |
| Yuman | 0.0 /100 | #300 | Tragic $35,377 |
| Pima | 0.0 /100 | #301 | Tragic $35,326 |
| Blacks/African Americans | 0.0 /100 | #302 | Tragic $35,315 |
| Immigrants | Latin America | 0.0 /100 | #303 | Tragic $35,307 |
| Crow | 0.0 /100 | #304 | Tragic $35,266 |
| Bahamians | 0.0 /100 | #305 | Tragic $35,125 |
| Fijians | 0.0 /100 | #306 | Tragic $35,114 |
| Sioux | 0.0 /100 | #307 | Tragic $35,063 |
| Immigrants | Bahamas | 0.0 /100 | #308 | Tragic $35,027 |
Demographics Similar to Immigrants from England by Median Female Earnings
In terms of median female earnings, the demographic groups most similar to Immigrants from England are Korean ($41,276, a difference of 0.0%), Immigrants from Brazil ($41,273, a difference of 0.010%), Macedonian ($41,286, a difference of 0.020%), Barbadian ($41,261, a difference of 0.040%), and Immigrants from North America ($41,319, a difference of 0.10%).
| Demographics | Rating | Rank | Median Female Earnings |
| Palestinians | 97.6 /100 | #107 | Exceptional $41,484 |
| Jordanians | 97.5 /100 | #108 | Exceptional $41,464 |
| Chinese | 97.5 /100 | #109 | Exceptional $41,461 |
| Immigrants | Western Asia | 97.0 /100 | #110 | Exceptional $41,375 |
| Immigrants | Canada | 97.0 /100 | #111 | Exceptional $41,373 |
| Immigrants | North America | 96.7 /100 | #112 | Exceptional $41,319 |
| Macedonians | 96.4 /100 | #113 | Exceptional $41,286 |
| Immigrants | England | 96.4 /100 | #114 | Exceptional $41,277 |
| Koreans | 96.4 /100 | #115 | Exceptional $41,276 |
| Immigrants | Brazil | 96.4 /100 | #116 | Exceptional $41,273 |
| Barbadians | 96.3 /100 | #117 | Exceptional $41,261 |
| Immigrants | Lebanon | 95.6 /100 | #118 | Exceptional $41,183 |
| Immigrants | Philippines | 95.0 /100 | #119 | Exceptional $41,114 |
| Immigrants | Kuwait | 94.4 /100 | #120 | Exceptional $41,055 |
| Croatians | 93.7 /100 | #121 | Exceptional $40,993 |