Pima vs Yugoslavian Median Female Earnings
COMPARE
Pima
Yugoslavian
Median Female Earnings
Median Female Earnings Comparison
Pima
Yugoslavians
$35,326
MEDIAN FEMALE EARNINGS
0.0/ 100
METRIC RATING
301st/ 347
METRIC RANK
$38,573
MEDIAN FEMALE EARNINGS
8.8/ 100
METRIC RATING
220th/ 347
METRIC RANK
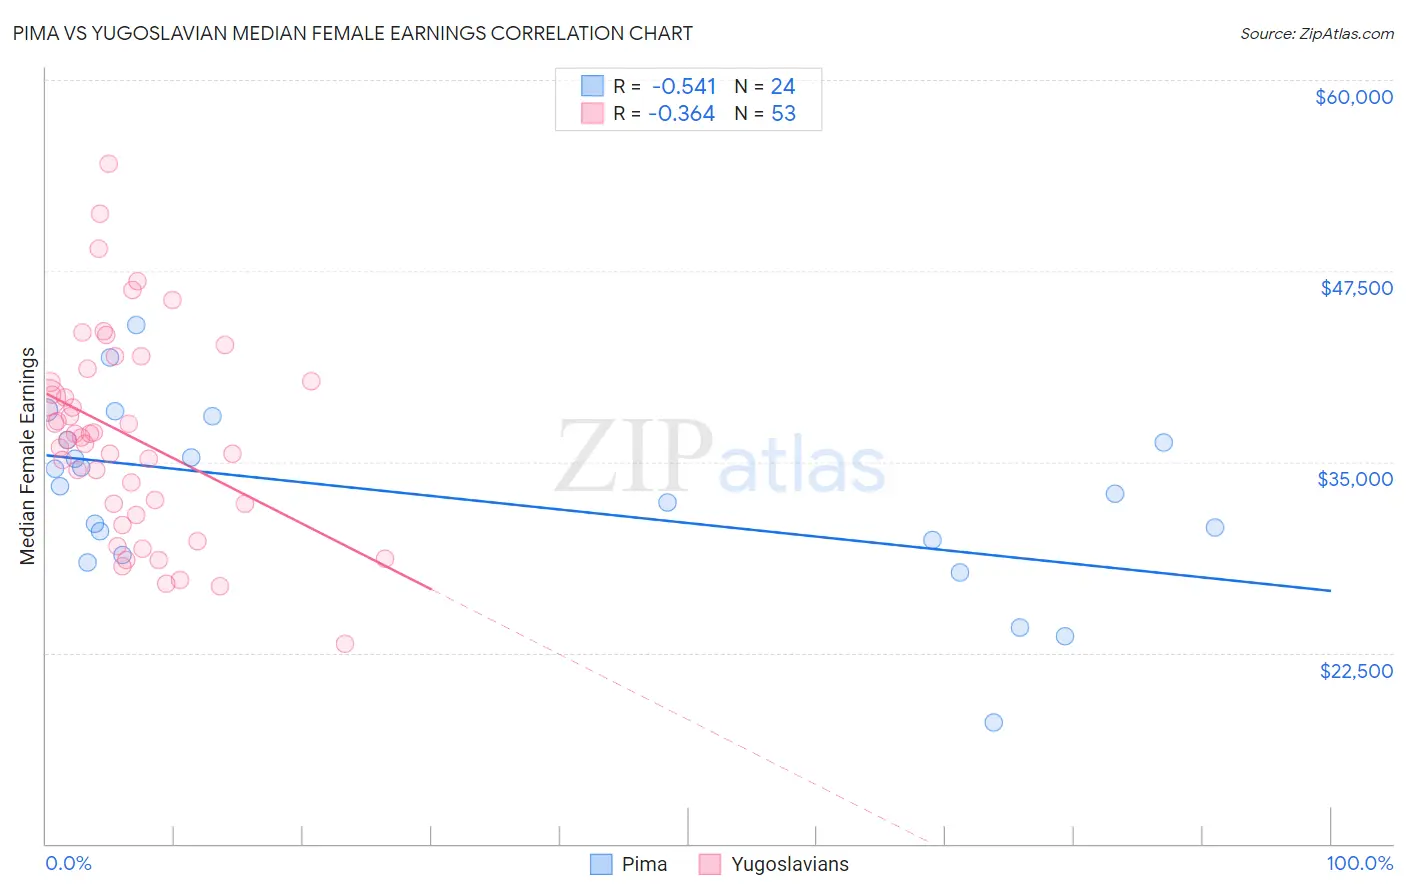
Pima vs Yugoslavian Median Female Earnings Correlation Chart
The statistical analysis conducted on geographies consisting of 61,524,471 people shows a substantial negative correlation between the proportion of Pima and median female earnings in the United States with a correlation coefficient (R) of -0.541 and weighted average of $35,326. Similarly, the statistical analysis conducted on geographies consisting of 285,638,776 people shows a mild negative correlation between the proportion of Yugoslavians and median female earnings in the United States with a correlation coefficient (R) of -0.364 and weighted average of $38,573, a difference of 9.2%.
Median Female Earnings Correlation Summary
| Measurement | Pima | Yugoslavian |
| Minimum | $17,917 | $23,125 |
| Maximum | $43,952 | $54,556 |
| Range | $26,035 | $31,431 |
| Mean | $32,676 | $36,696 |
| Median | $33,171 | $36,579 |
| Interquartile 25% (IQ1) | $29,398 | $31,882 |
| Interquartile 75% (IQ3) | $36,333 | $40,715 |
| Interquartile Range (IQR) | $6,935 | $8,834 |
| Standard Deviation (Sample) | $5,900 | $6,632 |
| Standard Deviation (Population) | $5,776 | $6,570 |
Similar Demographics by Median Female Earnings
Demographics Similar to Pima by Median Female Earnings
In terms of median female earnings, the demographic groups most similar to Pima are Black/African American ($35,315, a difference of 0.030%), Immigrants from Latin America ($35,307, a difference of 0.050%), Yuman ($35,377, a difference of 0.14%), Crow ($35,266, a difference of 0.17%), and Immigrants from Guatemala ($35,444, a difference of 0.33%).
| Demographics | Rating | Rank | Median Female Earnings |
| Cheyenne | 0.0 /100 | #294 | Tragic $35,673 |
| Comanche | 0.0 /100 | #295 | Tragic $35,661 |
| Mexican American Indians | 0.0 /100 | #296 | Tragic $35,629 |
| Hmong | 0.0 /100 | #297 | Tragic $35,498 |
| Immigrants | Micronesia | 0.0 /100 | #298 | Tragic $35,477 |
| Immigrants | Guatemala | 0.0 /100 | #299 | Tragic $35,444 |
| Yuman | 0.0 /100 | #300 | Tragic $35,377 |
| Pima | 0.0 /100 | #301 | Tragic $35,326 |
| Blacks/African Americans | 0.0 /100 | #302 | Tragic $35,315 |
| Immigrants | Latin America | 0.0 /100 | #303 | Tragic $35,307 |
| Crow | 0.0 /100 | #304 | Tragic $35,266 |
| Bahamians | 0.0 /100 | #305 | Tragic $35,125 |
| Fijians | 0.0 /100 | #306 | Tragic $35,114 |
| Sioux | 0.0 /100 | #307 | Tragic $35,063 |
| Immigrants | Bahamas | 0.0 /100 | #308 | Tragic $35,027 |
Demographics Similar to Yugoslavians by Median Female Earnings
In terms of median female earnings, the demographic groups most similar to Yugoslavians are Immigrants from the Azores ($38,573, a difference of 0.0%), Nepalese ($38,603, a difference of 0.080%), Cape Verdean ($38,614, a difference of 0.11%), Japanese ($38,528, a difference of 0.12%), and Immigrants from Jamaica ($38,625, a difference of 0.14%).
| Demographics | Rating | Rank | Median Female Earnings |
| Jamaicans | 10.5 /100 | #213 | Poor $38,670 |
| Iraqis | 10.5 /100 | #214 | Poor $38,666 |
| Spaniards | 10.3 /100 | #215 | Poor $38,656 |
| Immigrants | Ecuador | 10.1 /100 | #216 | Poor $38,644 |
| Immigrants | Jamaica | 9.7 /100 | #217 | Tragic $38,625 |
| Cape Verdeans | 9.5 /100 | #218 | Tragic $38,614 |
| Nepalese | 9.3 /100 | #219 | Tragic $38,603 |
| Yugoslavians | 8.8 /100 | #220 | Tragic $38,573 |
| Immigrants | Azores | 8.8 /100 | #221 | Tragic $38,573 |
| Japanese | 8.1 /100 | #222 | Tragic $38,528 |
| Immigrants | Sudan | 7.8 /100 | #223 | Tragic $38,511 |
| Native Hawaiians | 7.1 /100 | #224 | Tragic $38,461 |
| French | 7.0 /100 | #225 | Tragic $38,457 |
| French Canadians | 6.8 /100 | #226 | Tragic $38,436 |
| Scottish | 6.3 /100 | #227 | Tragic $38,397 |