Menominee vs Immigrants from Bangladesh Median Female Earnings
COMPARE
Menominee
Immigrants from Bangladesh
Median Female Earnings
Median Female Earnings Comparison
Menominee
Immigrants from Bangladesh
$33,894
MEDIAN FEMALE EARNINGS
0.0/ 100
METRIC RATING
330th/ 347
METRIC RANK
$39,910
MEDIAN FEMALE EARNINGS
60.8/ 100
METRIC RATING
165th/ 347
METRIC RANK
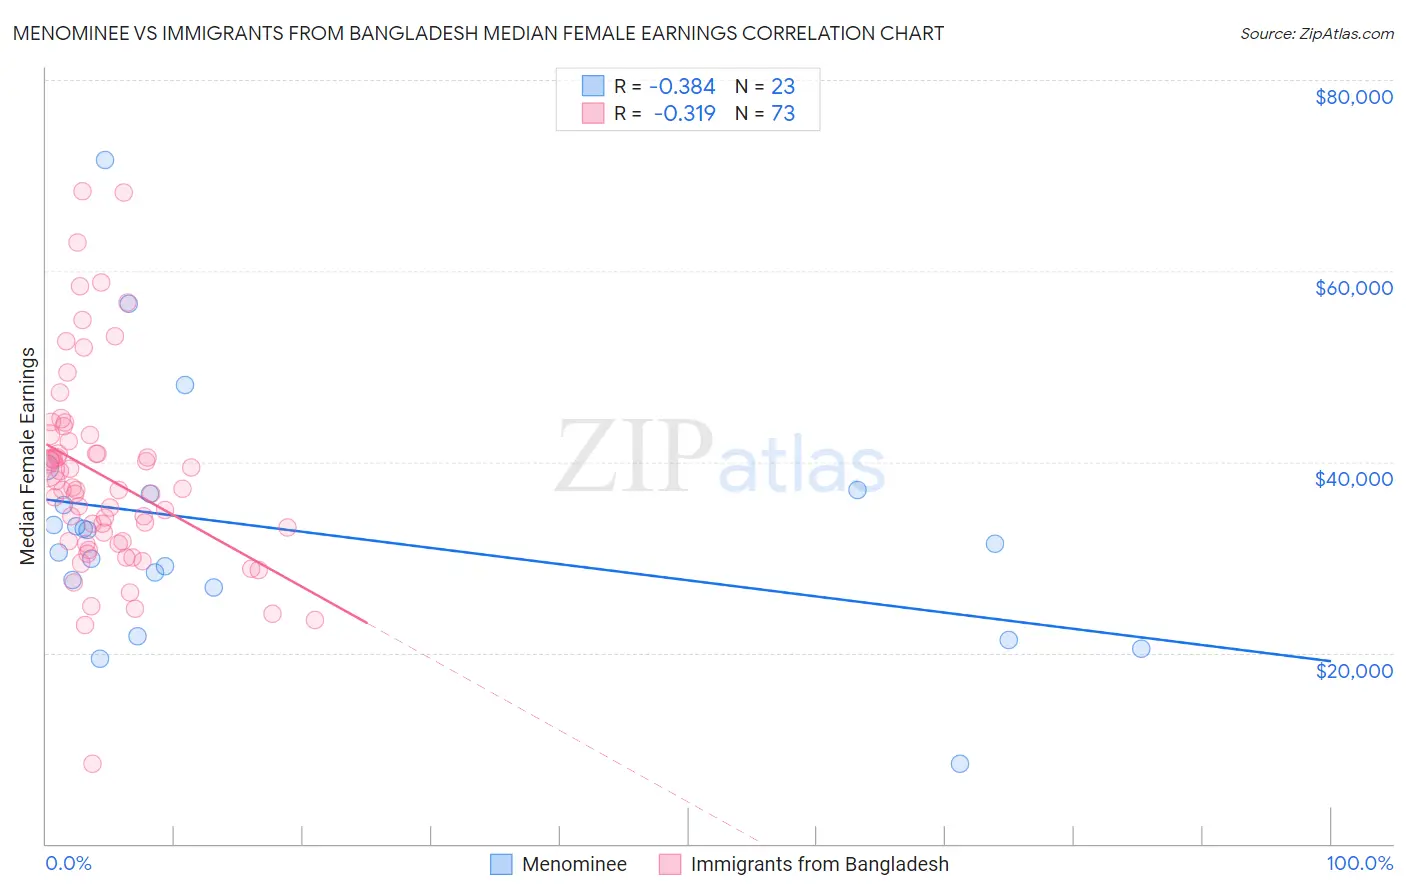
Menominee vs Immigrants from Bangladesh Median Female Earnings Correlation Chart
The statistical analysis conducted on geographies consisting of 45,775,261 people shows a mild negative correlation between the proportion of Menominee and median female earnings in the United States with a correlation coefficient (R) of -0.384 and weighted average of $33,894. Similarly, the statistical analysis conducted on geographies consisting of 203,663,307 people shows a mild negative correlation between the proportion of Immigrants from Bangladesh and median female earnings in the United States with a correlation coefficient (R) of -0.319 and weighted average of $39,910, a difference of 17.7%.
Median Female Earnings Correlation Summary
| Measurement | Menominee | Immigrants from Bangladesh |
| Minimum | $8,333 | $8,380 |
| Maximum | $71,591 | $68,327 |
| Range | $63,258 | $59,947 |
| Mean | $32,691 | $38,386 |
| Median | $31,453 | $37,048 |
| Interquartile 25% (IQ1) | $26,780 | $31,570 |
| Interquartile 75% (IQ3) | $36,632 | $42,477 |
| Interquartile Range (IQR) | $9,852 | $10,907 |
| Standard Deviation (Sample) | $12,945 | $10,596 |
| Standard Deviation (Population) | $12,660 | $10,523 |
Similar Demographics by Median Female Earnings
Demographics Similar to Menominee by Median Female Earnings
In terms of median female earnings, the demographic groups most similar to Menominee are Hopi ($33,932, a difference of 0.11%), Immigrants from Central America ($33,953, a difference of 0.17%), Native/Alaskan ($33,806, a difference of 0.26%), Choctaw ($33,775, a difference of 0.35%), and Cajun ($34,034, a difference of 0.41%).
| Demographics | Rating | Rank | Median Female Earnings |
| Seminole | 0.0 /100 | #323 | Tragic $34,385 |
| Immigrants | Congo | 0.0 /100 | #324 | Tragic $34,317 |
| Dutch West Indians | 0.0 /100 | #325 | Tragic $34,106 |
| Kiowa | 0.0 /100 | #326 | Tragic $34,074 |
| Cajuns | 0.0 /100 | #327 | Tragic $34,034 |
| Immigrants | Central America | 0.0 /100 | #328 | Tragic $33,953 |
| Hopi | 0.0 /100 | #329 | Tragic $33,932 |
| Menominee | 0.0 /100 | #330 | Tragic $33,894 |
| Natives/Alaskans | 0.0 /100 | #331 | Tragic $33,806 |
| Choctaw | 0.0 /100 | #332 | Tragic $33,775 |
| Mexicans | 0.0 /100 | #333 | Tragic $33,664 |
| Spanish American Indians | 0.0 /100 | #334 | Tragic $33,625 |
| Creek | 0.0 /100 | #335 | Tragic $33,437 |
| Ottawa | 0.0 /100 | #336 | Tragic $33,378 |
| Yakama | 0.0 /100 | #337 | Tragic $33,354 |
Demographics Similar to Immigrants from Bangladesh by Median Female Earnings
In terms of median female earnings, the demographic groups most similar to Immigrants from Bangladesh are Immigrants from Ghana ($39,894, a difference of 0.040%), Luxembourger ($39,891, a difference of 0.050%), Immigrants from Peru ($39,871, a difference of 0.10%), Immigrants from Saudi Arabia ($39,952, a difference of 0.11%), and Kenyan ($39,860, a difference of 0.12%).
| Demographics | Rating | Rank | Median Female Earnings |
| Immigrants | Senegal | 72.2 /100 | #158 | Good $40,157 |
| Immigrants | Vietnam | 72.0 /100 | #159 | Good $40,153 |
| Inupiat | 68.9 /100 | #160 | Good $40,080 |
| Alsatians | 68.0 /100 | #161 | Good $40,060 |
| South American Indians | 66.1 /100 | #162 | Good $40,019 |
| Lebanese | 65.5 /100 | #163 | Good $40,006 |
| Immigrants | Saudi Arabia | 62.9 /100 | #164 | Good $39,952 |
| Immigrants | Bangladesh | 60.8 /100 | #165 | Good $39,910 |
| Immigrants | Ghana | 60.0 /100 | #166 | Good $39,894 |
| Luxembourgers | 59.9 /100 | #167 | Average $39,891 |
| Immigrants | Peru | 58.9 /100 | #168 | Average $39,871 |
| Kenyans | 58.4 /100 | #169 | Average $39,860 |
| Slovenes | 56.2 /100 | #170 | Average $39,817 |
| Immigrants | Portugal | 54.7 /100 | #171 | Average $39,788 |
| British | 53.8 /100 | #172 | Average $39,772 |