Pima vs Yuman Median Female Earnings
COMPARE
Pima
Yuman
Median Female Earnings
Median Female Earnings Comparison
Pima
Yuman
$35,326
MEDIAN FEMALE EARNINGS
0.0/ 100
METRIC RATING
301st/ 347
METRIC RANK
$35,377
MEDIAN FEMALE EARNINGS
0.0/ 100
METRIC RATING
300th/ 347
METRIC RANK
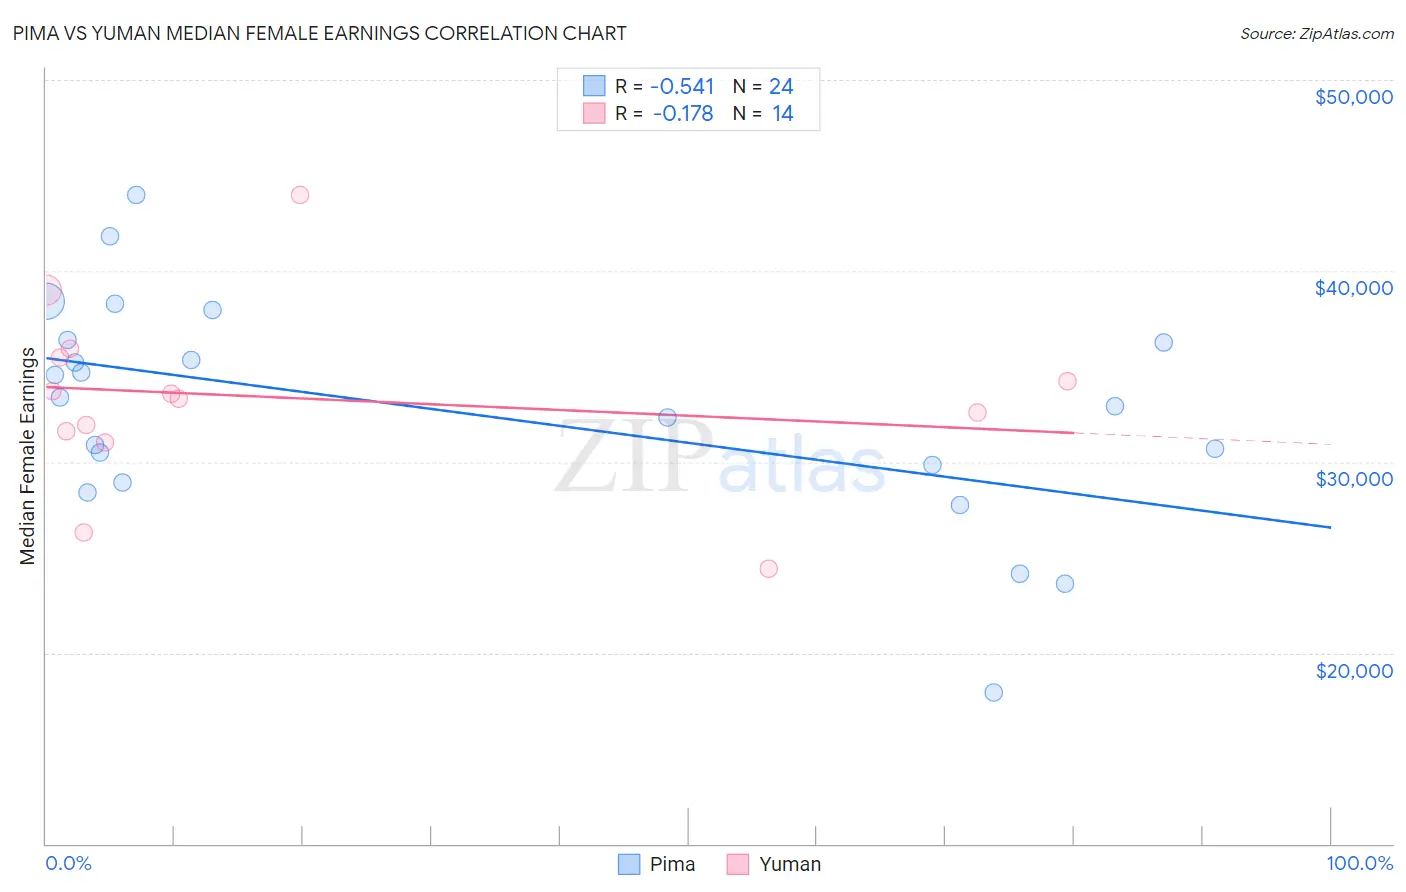
Pima vs Yuman Median Female Earnings Correlation Chart
The statistical analysis conducted on geographies consisting of 61,524,471 people shows a substantial negative correlation between the proportion of Pima and median female earnings in the United States with a correlation coefficient (R) of -0.541 and weighted average of $35,326. Similarly, the statistical analysis conducted on geographies consisting of 40,678,701 people shows a poor negative correlation between the proportion of Yuman and median female earnings in the United States with a correlation coefficient (R) of -0.178 and weighted average of $35,377, a difference of 0.14%.
Median Female Earnings Correlation Summary
| Measurement | Pima | Yuman |
| Minimum | $17,917 | $24,415 |
| Maximum | $43,952 | $43,952 |
| Range | $26,035 | $19,537 |
| Mean | $32,676 | $33,355 |
| Median | $33,171 | $33,435 |
| Interquartile 25% (IQ1) | $29,398 | $31,604 |
| Interquartile 75% (IQ3) | $36,333 | $35,454 |
| Interquartile Range (IQR) | $6,935 | $3,850 |
| Standard Deviation (Sample) | $5,900 | $4,771 |
| Standard Deviation (Population) | $5,776 | $4,598 |
Demographics Similar to Pima and Yuman by Median Female Earnings
In terms of median female earnings, the demographic groups most similar to Pima are Black/African American ($35,315, a difference of 0.030%), Immigrants from Latin America ($35,307, a difference of 0.050%), Crow ($35,266, a difference of 0.17%), Immigrants from Guatemala ($35,444, a difference of 0.33%), and Immigrants from Micronesia ($35,477, a difference of 0.43%). Similarly, the demographic groups most similar to Yuman are Black/African American ($35,315, a difference of 0.18%), Immigrants from Guatemala ($35,444, a difference of 0.19%), Immigrants from Latin America ($35,307, a difference of 0.20%), Immigrants from Micronesia ($35,477, a difference of 0.28%), and Crow ($35,266, a difference of 0.31%).
| Demographics | Rating | Rank | Median Female Earnings |
| Central American Indians | 0.0 /100 | #290 | Tragic $35,930 |
| Blackfeet | 0.0 /100 | #291 | Tragic $35,864 |
| Americans | 0.0 /100 | #292 | Tragic $35,777 |
| Guatemalans | 0.0 /100 | #293 | Tragic $35,695 |
| Cheyenne | 0.0 /100 | #294 | Tragic $35,673 |
| Comanche | 0.0 /100 | #295 | Tragic $35,661 |
| Mexican American Indians | 0.0 /100 | #296 | Tragic $35,629 |
| Hmong | 0.0 /100 | #297 | Tragic $35,498 |
| Immigrants | Micronesia | 0.0 /100 | #298 | Tragic $35,477 |
| Immigrants | Guatemala | 0.0 /100 | #299 | Tragic $35,444 |
| Yuman | 0.0 /100 | #300 | Tragic $35,377 |
| Pima | 0.0 /100 | #301 | Tragic $35,326 |
| Blacks/African Americans | 0.0 /100 | #302 | Tragic $35,315 |
| Immigrants | Latin America | 0.0 /100 | #303 | Tragic $35,307 |
| Crow | 0.0 /100 | #304 | Tragic $35,266 |
| Bahamians | 0.0 /100 | #305 | Tragic $35,125 |
| Fijians | 0.0 /100 | #306 | Tragic $35,114 |
| Sioux | 0.0 /100 | #307 | Tragic $35,063 |
| Immigrants | Bahamas | 0.0 /100 | #308 | Tragic $35,027 |
| Hondurans | 0.0 /100 | #309 | Tragic $35,013 |
| Chippewa | 0.0 /100 | #310 | Tragic $35,003 |