Pima vs Russian Median Female Earnings
COMPARE
Pima
Russian
Median Female Earnings
Median Female Earnings Comparison
Pima
Russians
$35,326
MEDIAN FEMALE EARNINGS
0.0/ 100
METRIC RATING
301st/ 347
METRIC RANK
$44,169
MEDIAN FEMALE EARNINGS
100.0/ 100
METRIC RATING
34th/ 347
METRIC RANK
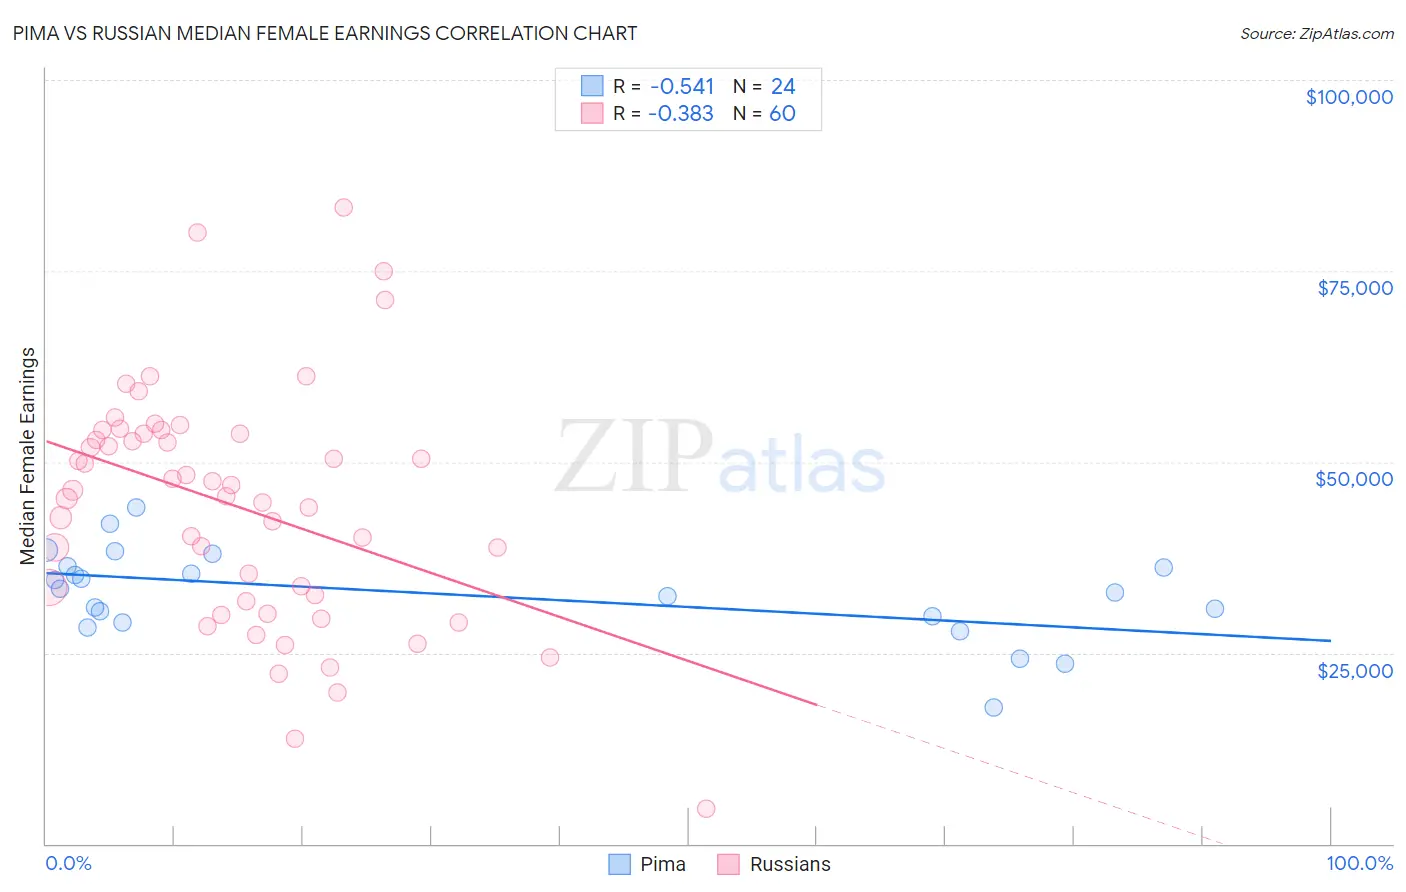
Pima vs Russian Median Female Earnings Correlation Chart
The statistical analysis conducted on geographies consisting of 61,524,471 people shows a substantial negative correlation between the proportion of Pima and median female earnings in the United States with a correlation coefficient (R) of -0.541 and weighted average of $35,326. Similarly, the statistical analysis conducted on geographies consisting of 511,592,990 people shows a mild negative correlation between the proportion of Russians and median female earnings in the United States with a correlation coefficient (R) of -0.383 and weighted average of $44,169, a difference of 25.0%.
Median Female Earnings Correlation Summary
| Measurement | Pima | Russian |
| Minimum | $17,917 | $4,625 |
| Maximum | $43,952 | $83,305 |
| Range | $26,035 | $78,680 |
| Mean | $32,676 | $44,153 |
| Median | $33,171 | $45,890 |
| Interquartile 25% (IQ1) | $29,398 | $32,157 |
| Interquartile 75% (IQ3) | $36,333 | $53,697 |
| Interquartile Range (IQR) | $6,935 | $21,540 |
| Standard Deviation (Sample) | $5,900 | $15,453 |
| Standard Deviation (Population) | $5,776 | $15,323 |
Similar Demographics by Median Female Earnings
Demographics Similar to Pima by Median Female Earnings
In terms of median female earnings, the demographic groups most similar to Pima are Black/African American ($35,315, a difference of 0.030%), Immigrants from Latin America ($35,307, a difference of 0.050%), Yuman ($35,377, a difference of 0.14%), Crow ($35,266, a difference of 0.17%), and Immigrants from Guatemala ($35,444, a difference of 0.33%).
| Demographics | Rating | Rank | Median Female Earnings |
| Cheyenne | 0.0 /100 | #294 | Tragic $35,673 |
| Comanche | 0.0 /100 | #295 | Tragic $35,661 |
| Mexican American Indians | 0.0 /100 | #296 | Tragic $35,629 |
| Hmong | 0.0 /100 | #297 | Tragic $35,498 |
| Immigrants | Micronesia | 0.0 /100 | #298 | Tragic $35,477 |
| Immigrants | Guatemala | 0.0 /100 | #299 | Tragic $35,444 |
| Yuman | 0.0 /100 | #300 | Tragic $35,377 |
| Pima | 0.0 /100 | #301 | Tragic $35,326 |
| Blacks/African Americans | 0.0 /100 | #302 | Tragic $35,315 |
| Immigrants | Latin America | 0.0 /100 | #303 | Tragic $35,307 |
| Crow | 0.0 /100 | #304 | Tragic $35,266 |
| Bahamians | 0.0 /100 | #305 | Tragic $35,125 |
| Fijians | 0.0 /100 | #306 | Tragic $35,114 |
| Sioux | 0.0 /100 | #307 | Tragic $35,063 |
| Immigrants | Bahamas | 0.0 /100 | #308 | Tragic $35,027 |
Demographics Similar to Russians by Median Female Earnings
In terms of median female earnings, the demographic groups most similar to Russians are Immigrants from Sri Lanka ($44,161, a difference of 0.020%), Immigrants from Asia ($44,198, a difference of 0.070%), Immigrants from Turkey ($44,066, a difference of 0.23%), Immigrants from Switzerland ($43,996, a difference of 0.39%), and Immigrants from Northern Europe ($44,366, a difference of 0.44%).
| Demographics | Rating | Rank | Median Female Earnings |
| Turks | 100.0 /100 | #27 | Exceptional $44,695 |
| Immigrants | Russia | 100.0 /100 | #28 | Exceptional $44,680 |
| Immigrants | Belgium | 100.0 /100 | #29 | Exceptional $44,587 |
| Asians | 100.0 /100 | #30 | Exceptional $44,586 |
| Immigrants | France | 100.0 /100 | #31 | Exceptional $44,541 |
| Immigrants | Northern Europe | 100.0 /100 | #32 | Exceptional $44,366 |
| Immigrants | Asia | 100.0 /100 | #33 | Exceptional $44,198 |
| Russians | 100.0 /100 | #34 | Exceptional $44,169 |
| Immigrants | Sri Lanka | 100.0 /100 | #35 | Exceptional $44,161 |
| Immigrants | Turkey | 100.0 /100 | #36 | Exceptional $44,066 |
| Immigrants | Switzerland | 100.0 /100 | #37 | Exceptional $43,996 |
| Latvians | 100.0 /100 | #38 | Exceptional $43,941 |
| Israelis | 100.0 /100 | #39 | Exceptional $43,852 |
| Immigrants | Malaysia | 100.0 /100 | #40 | Exceptional $43,835 |
| Bhutanese | 100.0 /100 | #41 | Exceptional $43,648 |