Immigrants from Sierra Leone vs Immigrants from Bangladesh Median Female Earnings
COMPARE
Immigrants from Sierra Leone
Immigrants from Bangladesh
Median Female Earnings
Median Female Earnings Comparison
Immigrants from Sierra Leone
Immigrants from Bangladesh
$42,214
MEDIAN FEMALE EARNINGS
99.5/ 100
METRIC RATING
83rd/ 347
METRIC RANK
$39,910
MEDIAN FEMALE EARNINGS
60.8/ 100
METRIC RATING
165th/ 347
METRIC RANK
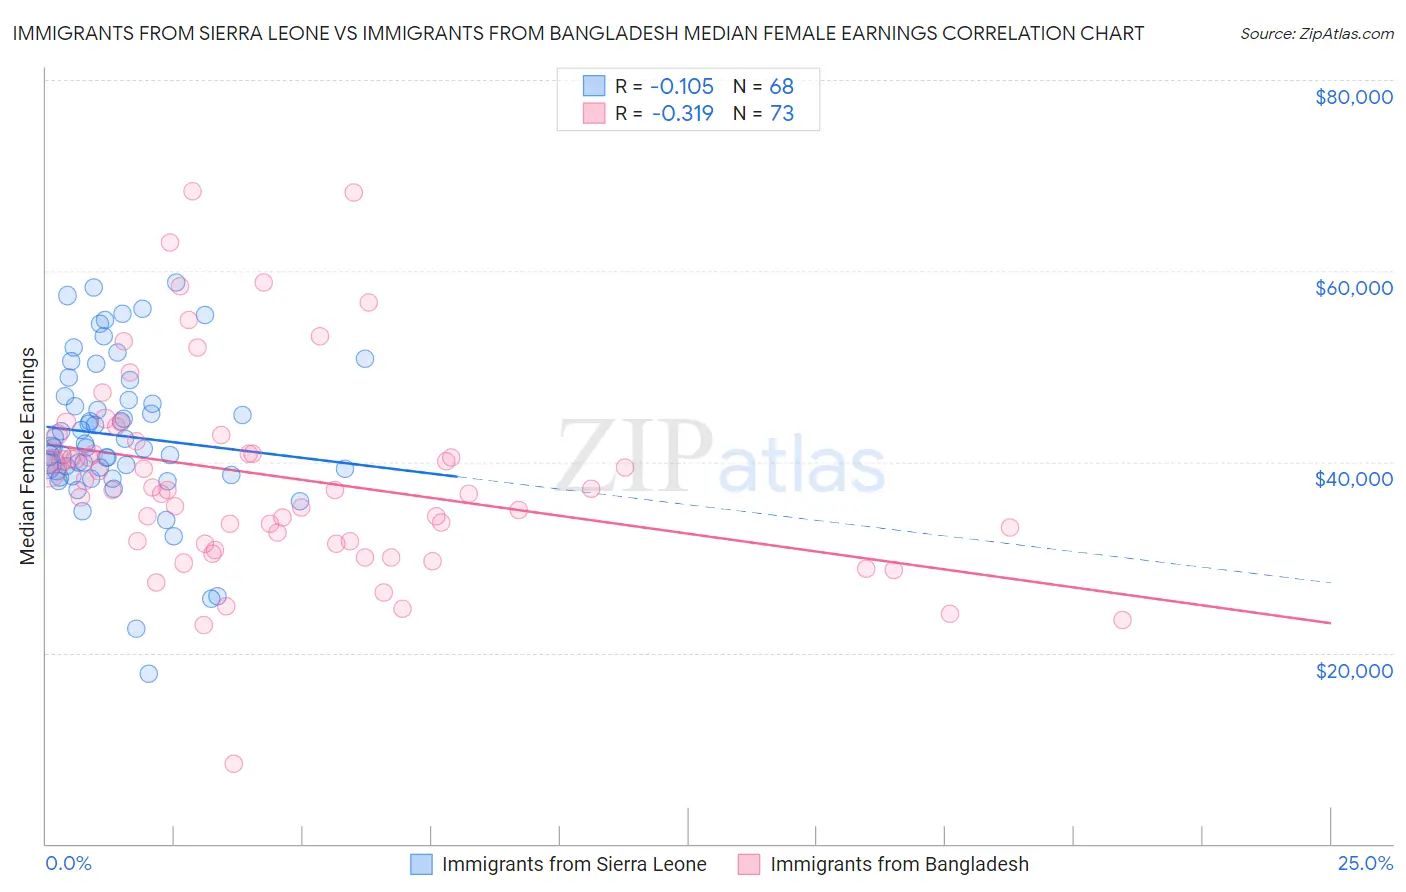
Immigrants from Sierra Leone vs Immigrants from Bangladesh Median Female Earnings Correlation Chart
The statistical analysis conducted on geographies consisting of 101,627,832 people shows a poor negative correlation between the proportion of Immigrants from Sierra Leone and median female earnings in the United States with a correlation coefficient (R) of -0.105 and weighted average of $42,214. Similarly, the statistical analysis conducted on geographies consisting of 203,663,307 people shows a mild negative correlation between the proportion of Immigrants from Bangladesh and median female earnings in the United States with a correlation coefficient (R) of -0.319 and weighted average of $39,910, a difference of 5.8%.
Median Female Earnings Correlation Summary
| Measurement | Immigrants from Sierra Leone | Immigrants from Bangladesh |
| Minimum | $17,869 | $8,380 |
| Maximum | $58,839 | $68,327 |
| Range | $40,970 | $59,947 |
| Mean | $42,763 | $38,386 |
| Median | $41,611 | $37,048 |
| Interquartile 25% (IQ1) | $38,837 | $31,570 |
| Interquartile 75% (IQ3) | $46,686 | $42,477 |
| Interquartile Range (IQR) | $7,849 | $10,907 |
| Standard Deviation (Sample) | $8,036 | $10,596 |
| Standard Deviation (Population) | $7,977 | $10,523 |
Similar Demographics by Median Female Earnings
Demographics Similar to Immigrants from Sierra Leone by Median Female Earnings
In terms of median female earnings, the demographic groups most similar to Immigrants from Sierra Leone are Armenian ($42,212, a difference of 0.010%), Immigrants from Morocco ($42,229, a difference of 0.030%), Immigrants from Southern Europe ($42,275, a difference of 0.14%), Laotian ($42,133, a difference of 0.19%), and Immigrants from Moldova ($42,304, a difference of 0.21%).
| Demographics | Rating | Rank | Median Female Earnings |
| Immigrants | Italy | 99.7 /100 | #76 | Exceptional $42,446 |
| Immigrants | Albania | 99.6 /100 | #77 | Exceptional $42,388 |
| Immigrants | Kazakhstan | 99.6 /100 | #78 | Exceptional $42,386 |
| Greeks | 99.6 /100 | #79 | Exceptional $42,336 |
| Immigrants | Moldova | 99.6 /100 | #80 | Exceptional $42,304 |
| Immigrants | Southern Europe | 99.5 /100 | #81 | Exceptional $42,275 |
| Immigrants | Morocco | 99.5 /100 | #82 | Exceptional $42,229 |
| Immigrants | Sierra Leone | 99.5 /100 | #83 | Exceptional $42,214 |
| Armenians | 99.5 /100 | #84 | Exceptional $42,212 |
| Laotians | 99.4 /100 | #85 | Exceptional $42,133 |
| Immigrants | St. Vincent and the Grenadines | 99.3 /100 | #86 | Exceptional $42,108 |
| Lithuanians | 99.3 /100 | #87 | Exceptional $42,108 |
| Immigrants | Northern Africa | 99.3 /100 | #88 | Exceptional $42,084 |
| Immigrants | Afghanistan | 99.3 /100 | #89 | Exceptional $42,055 |
| Ukrainians | 99.2 /100 | #90 | Exceptional $42,015 |
Demographics Similar to Immigrants from Bangladesh by Median Female Earnings
In terms of median female earnings, the demographic groups most similar to Immigrants from Bangladesh are Immigrants from Ghana ($39,894, a difference of 0.040%), Luxembourger ($39,891, a difference of 0.050%), Immigrants from Peru ($39,871, a difference of 0.10%), Immigrants from Saudi Arabia ($39,952, a difference of 0.11%), and Kenyan ($39,860, a difference of 0.12%).
| Demographics | Rating | Rank | Median Female Earnings |
| Immigrants | Senegal | 72.2 /100 | #158 | Good $40,157 |
| Immigrants | Vietnam | 72.0 /100 | #159 | Good $40,153 |
| Inupiat | 68.9 /100 | #160 | Good $40,080 |
| Alsatians | 68.0 /100 | #161 | Good $40,060 |
| South American Indians | 66.1 /100 | #162 | Good $40,019 |
| Lebanese | 65.5 /100 | #163 | Good $40,006 |
| Immigrants | Saudi Arabia | 62.9 /100 | #164 | Good $39,952 |
| Immigrants | Bangladesh | 60.8 /100 | #165 | Good $39,910 |
| Immigrants | Ghana | 60.0 /100 | #166 | Good $39,894 |
| Luxembourgers | 59.9 /100 | #167 | Average $39,891 |
| Immigrants | Peru | 58.9 /100 | #168 | Average $39,871 |
| Kenyans | 58.4 /100 | #169 | Average $39,860 |
| Slovenes | 56.2 /100 | #170 | Average $39,817 |
| Immigrants | Portugal | 54.7 /100 | #171 | Average $39,788 |
| British | 53.8 /100 | #172 | Average $39,772 |