Pima vs British Median Female Earnings
COMPARE
Pima
British
Median Female Earnings
Median Female Earnings Comparison
Pima
British
$35,326
MEDIAN FEMALE EARNINGS
0.0/ 100
METRIC RATING
301st/ 347
METRIC RANK
$39,772
MEDIAN FEMALE EARNINGS
53.8/ 100
METRIC RATING
172nd/ 347
METRIC RANK
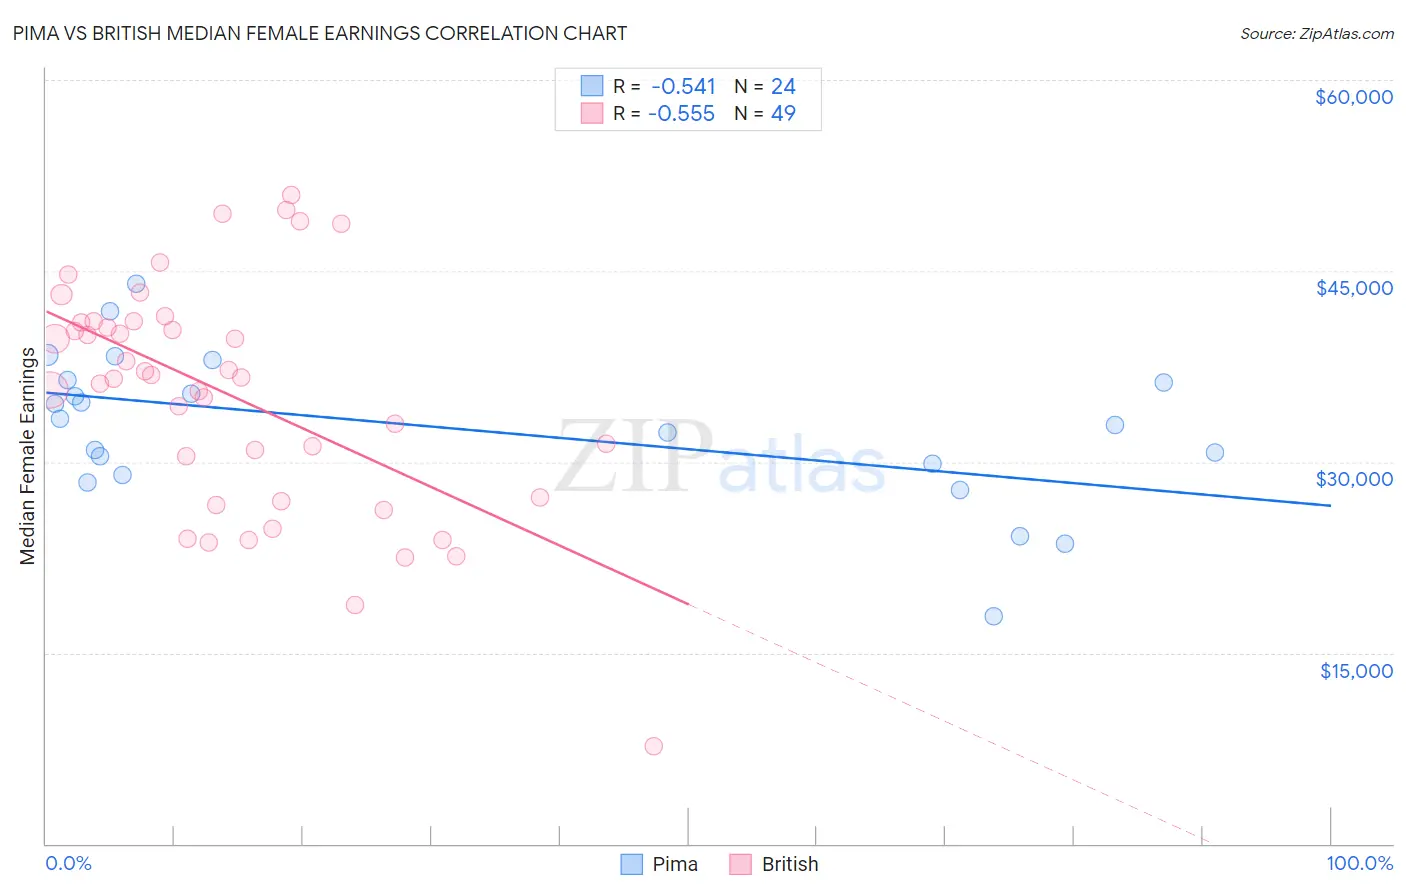
Pima vs British Median Female Earnings Correlation Chart
The statistical analysis conducted on geographies consisting of 61,524,471 people shows a substantial negative correlation between the proportion of Pima and median female earnings in the United States with a correlation coefficient (R) of -0.541 and weighted average of $35,326. Similarly, the statistical analysis conducted on geographies consisting of 530,644,409 people shows a substantial negative correlation between the proportion of British and median female earnings in the United States with a correlation coefficient (R) of -0.555 and weighted average of $39,772, a difference of 12.6%.
Median Female Earnings Correlation Summary
| Measurement | Pima | British |
| Minimum | $17,917 | $7,631 |
| Maximum | $43,952 | $50,972 |
| Range | $26,035 | $43,341 |
| Mean | $32,676 | $35,190 |
| Median | $33,171 | $36,667 |
| Interquartile 25% (IQ1) | $29,398 | $27,044 |
| Interquartile 75% (IQ3) | $36,333 | $41,037 |
| Interquartile Range (IQR) | $6,935 | $13,994 |
| Standard Deviation (Sample) | $5,900 | $9,173 |
| Standard Deviation (Population) | $5,776 | $9,079 |
Similar Demographics by Median Female Earnings
Demographics Similar to Pima by Median Female Earnings
In terms of median female earnings, the demographic groups most similar to Pima are Black/African American ($35,315, a difference of 0.030%), Immigrants from Latin America ($35,307, a difference of 0.050%), Yuman ($35,377, a difference of 0.14%), Crow ($35,266, a difference of 0.17%), and Immigrants from Guatemala ($35,444, a difference of 0.33%).
| Demographics | Rating | Rank | Median Female Earnings |
| Cheyenne | 0.0 /100 | #294 | Tragic $35,673 |
| Comanche | 0.0 /100 | #295 | Tragic $35,661 |
| Mexican American Indians | 0.0 /100 | #296 | Tragic $35,629 |
| Hmong | 0.0 /100 | #297 | Tragic $35,498 |
| Immigrants | Micronesia | 0.0 /100 | #298 | Tragic $35,477 |
| Immigrants | Guatemala | 0.0 /100 | #299 | Tragic $35,444 |
| Yuman | 0.0 /100 | #300 | Tragic $35,377 |
| Pima | 0.0 /100 | #301 | Tragic $35,326 |
| Blacks/African Americans | 0.0 /100 | #302 | Tragic $35,315 |
| Immigrants | Latin America | 0.0 /100 | #303 | Tragic $35,307 |
| Crow | 0.0 /100 | #304 | Tragic $35,266 |
| Bahamians | 0.0 /100 | #305 | Tragic $35,125 |
| Fijians | 0.0 /100 | #306 | Tragic $35,114 |
| Sioux | 0.0 /100 | #307 | Tragic $35,063 |
| Immigrants | Bahamas | 0.0 /100 | #308 | Tragic $35,027 |
Demographics Similar to British by Median Female Earnings
In terms of median female earnings, the demographic groups most similar to British are Immigrants from Portugal ($39,788, a difference of 0.040%), Slovene ($39,817, a difference of 0.11%), Canadian ($39,724, a difference of 0.12%), South American ($39,698, a difference of 0.19%), and Kenyan ($39,860, a difference of 0.22%).
| Demographics | Rating | Rank | Median Female Earnings |
| Immigrants | Bangladesh | 60.8 /100 | #165 | Good $39,910 |
| Immigrants | Ghana | 60.0 /100 | #166 | Good $39,894 |
| Luxembourgers | 59.9 /100 | #167 | Average $39,891 |
| Immigrants | Peru | 58.9 /100 | #168 | Average $39,871 |
| Kenyans | 58.4 /100 | #169 | Average $39,860 |
| Slovenes | 56.2 /100 | #170 | Average $39,817 |
| Immigrants | Portugal | 54.7 /100 | #171 | Average $39,788 |
| British | 53.8 /100 | #172 | Average $39,772 |
| Canadians | 51.4 /100 | #173 | Average $39,724 |
| South Americans | 50.0 /100 | #174 | Average $39,698 |
| Immigrants | South America | 47.2 /100 | #175 | Average $39,643 |
| Nigerians | 47.0 /100 | #176 | Average $39,641 |
| Costa Ricans | 46.1 /100 | #177 | Average $39,622 |
| Slavs | 45.6 /100 | #178 | Average $39,613 |
| Immigrants | Germany | 45.1 /100 | #179 | Average $39,603 |