Pima vs African Median Female Earnings
COMPARE
Pima
African
Median Female Earnings
Median Female Earnings Comparison
Pima
Africans
$35,326
MEDIAN FEMALE EARNINGS
0.0/ 100
METRIC RATING
301st/ 347
METRIC RANK
$36,530
MEDIAN FEMALE EARNINGS
0.1/ 100
METRIC RATING
275th/ 347
METRIC RANK
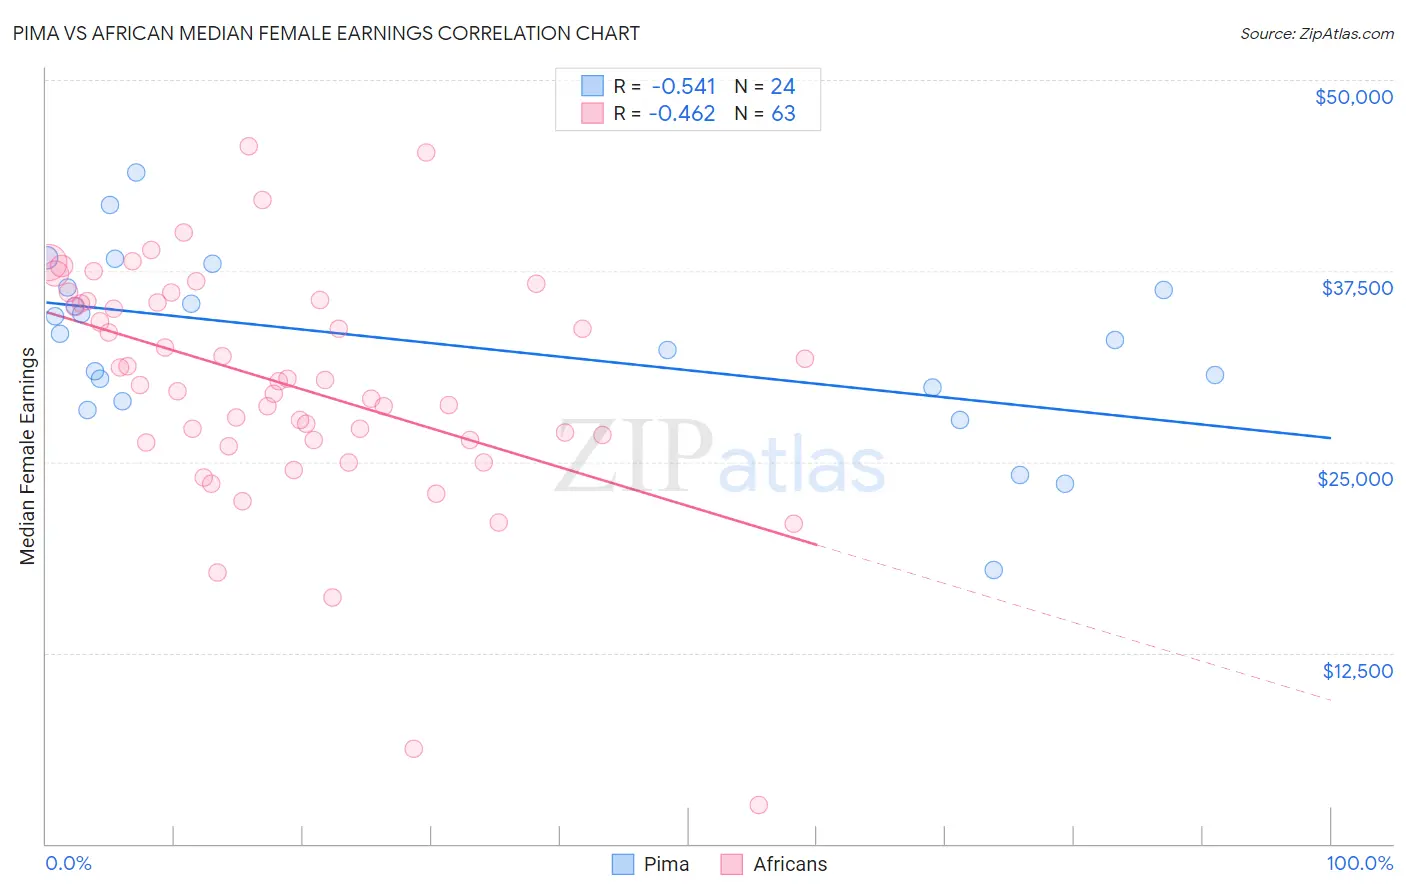
Pima vs African Median Female Earnings Correlation Chart
The statistical analysis conducted on geographies consisting of 61,524,471 people shows a substantial negative correlation between the proportion of Pima and median female earnings in the United States with a correlation coefficient (R) of -0.541 and weighted average of $35,326. Similarly, the statistical analysis conducted on geographies consisting of 469,717,352 people shows a moderate negative correlation between the proportion of Africans and median female earnings in the United States with a correlation coefficient (R) of -0.462 and weighted average of $36,530, a difference of 3.4%.
Median Female Earnings Correlation Summary
| Measurement | Pima | African |
| Minimum | $17,917 | $2,499 |
| Maximum | $43,952 | $45,656 |
| Range | $26,035 | $43,157 |
| Mean | $32,676 | $30,089 |
| Median | $33,171 | $30,270 |
| Interquartile 25% (IQ1) | $29,398 | $26,393 |
| Interquartile 75% (IQ3) | $36,333 | $35,526 |
| Interquartile Range (IQR) | $6,935 | $9,133 |
| Standard Deviation (Sample) | $5,900 | $7,747 |
| Standard Deviation (Population) | $5,776 | $7,685 |
Similar Demographics by Median Female Earnings
Demographics Similar to Pima by Median Female Earnings
In terms of median female earnings, the demographic groups most similar to Pima are Black/African American ($35,315, a difference of 0.030%), Immigrants from Latin America ($35,307, a difference of 0.050%), Yuman ($35,377, a difference of 0.14%), Crow ($35,266, a difference of 0.17%), and Immigrants from Guatemala ($35,444, a difference of 0.33%).
| Demographics | Rating | Rank | Median Female Earnings |
| Cheyenne | 0.0 /100 | #294 | Tragic $35,673 |
| Comanche | 0.0 /100 | #295 | Tragic $35,661 |
| Mexican American Indians | 0.0 /100 | #296 | Tragic $35,629 |
| Hmong | 0.0 /100 | #297 | Tragic $35,498 |
| Immigrants | Micronesia | 0.0 /100 | #298 | Tragic $35,477 |
| Immigrants | Guatemala | 0.0 /100 | #299 | Tragic $35,444 |
| Yuman | 0.0 /100 | #300 | Tragic $35,377 |
| Pima | 0.0 /100 | #301 | Tragic $35,326 |
| Blacks/African Americans | 0.0 /100 | #302 | Tragic $35,315 |
| Immigrants | Latin America | 0.0 /100 | #303 | Tragic $35,307 |
| Crow | 0.0 /100 | #304 | Tragic $35,266 |
| Bahamians | 0.0 /100 | #305 | Tragic $35,125 |
| Fijians | 0.0 /100 | #306 | Tragic $35,114 |
| Sioux | 0.0 /100 | #307 | Tragic $35,063 |
| Immigrants | Bahamas | 0.0 /100 | #308 | Tragic $35,027 |
Demographics Similar to Africans by Median Female Earnings
In terms of median female earnings, the demographic groups most similar to Africans are Central American ($36,492, a difference of 0.10%), Marshallese ($36,459, a difference of 0.19%), U.S. Virgin Islander ($36,424, a difference of 0.29%), Immigrants from Caribbean ($36,414, a difference of 0.32%), and Iroquois ($36,408, a difference of 0.34%).
| Demographics | Rating | Rank | Median Female Earnings |
| Cree | 0.4 /100 | #268 | Tragic $37,018 |
| Immigrants | Venezuela | 0.4 /100 | #269 | Tragic $37,003 |
| French American Indians | 0.3 /100 | #270 | Tragic $36,920 |
| Nicaraguans | 0.3 /100 | #271 | Tragic $36,904 |
| Immigrants | Dominican Republic | 0.3 /100 | #272 | Tragic $36,857 |
| Immigrants | Laos | 0.3 /100 | #273 | Tragic $36,841 |
| Immigrants | El Salvador | 0.2 /100 | #274 | Tragic $36,673 |
| Africans | 0.1 /100 | #275 | Tragic $36,530 |
| Central Americans | 0.1 /100 | #276 | Tragic $36,492 |
| Marshallese | 0.1 /100 | #277 | Tragic $36,459 |
| U.S. Virgin Islanders | 0.1 /100 | #278 | Tragic $36,424 |
| Immigrants | Caribbean | 0.1 /100 | #279 | Tragic $36,414 |
| Iroquois | 0.1 /100 | #280 | Tragic $36,408 |
| Spanish Americans | 0.1 /100 | #281 | Tragic $36,391 |
| Haitians | 0.1 /100 | #282 | Tragic $36,374 |