African vs Immigrants from Bangladesh Median Female Earnings
COMPARE
African
Immigrants from Bangladesh
Median Female Earnings
Median Female Earnings Comparison
Africans
Immigrants from Bangladesh
$36,530
MEDIAN FEMALE EARNINGS
0.1/ 100
METRIC RATING
275th/ 347
METRIC RANK
$39,910
MEDIAN FEMALE EARNINGS
60.8/ 100
METRIC RATING
165th/ 347
METRIC RANK
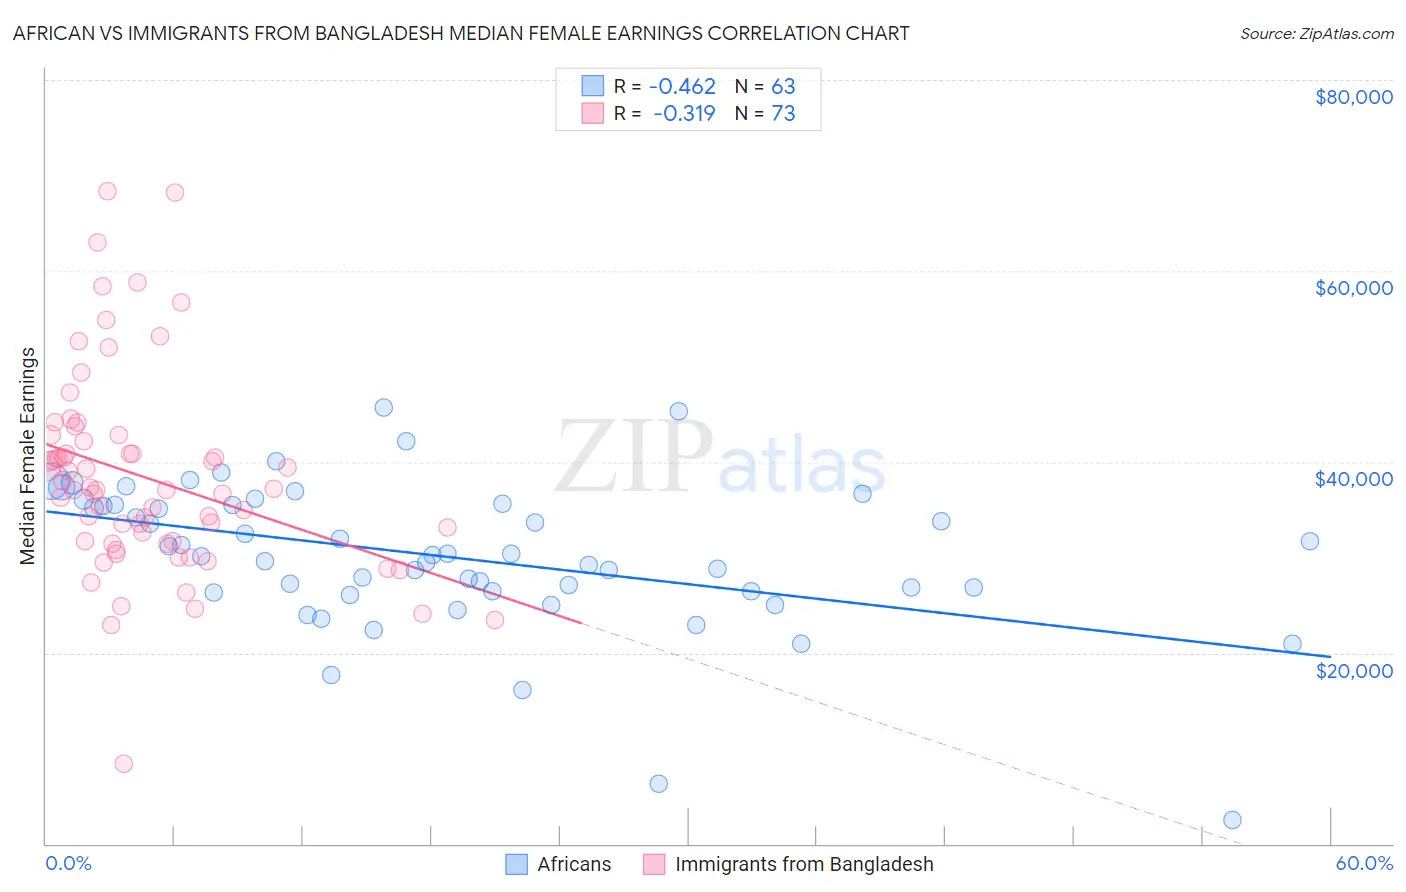
African vs Immigrants from Bangladesh Median Female Earnings Correlation Chart
The statistical analysis conducted on geographies consisting of 469,717,352 people shows a moderate negative correlation between the proportion of Africans and median female earnings in the United States with a correlation coefficient (R) of -0.462 and weighted average of $36,530. Similarly, the statistical analysis conducted on geographies consisting of 203,663,307 people shows a mild negative correlation between the proportion of Immigrants from Bangladesh and median female earnings in the United States with a correlation coefficient (R) of -0.319 and weighted average of $39,910, a difference of 9.2%.
Median Female Earnings Correlation Summary
| Measurement | African | Immigrants from Bangladesh |
| Minimum | $2,499 | $8,380 |
| Maximum | $45,656 | $68,327 |
| Range | $43,157 | $59,947 |
| Mean | $30,089 | $38,386 |
| Median | $30,270 | $37,048 |
| Interquartile 25% (IQ1) | $26,393 | $31,570 |
| Interquartile 75% (IQ3) | $35,526 | $42,477 |
| Interquartile Range (IQR) | $9,133 | $10,907 |
| Standard Deviation (Sample) | $7,747 | $10,596 |
| Standard Deviation (Population) | $7,685 | $10,523 |
Similar Demographics by Median Female Earnings
Demographics Similar to Africans by Median Female Earnings
In terms of median female earnings, the demographic groups most similar to Africans are Central American ($36,492, a difference of 0.10%), Marshallese ($36,459, a difference of 0.19%), U.S. Virgin Islander ($36,424, a difference of 0.29%), Immigrants from Caribbean ($36,414, a difference of 0.32%), and Iroquois ($36,408, a difference of 0.34%).
| Demographics | Rating | Rank | Median Female Earnings |
| Cree | 0.4 /100 | #268 | Tragic $37,018 |
| Immigrants | Venezuela | 0.4 /100 | #269 | Tragic $37,003 |
| French American Indians | 0.3 /100 | #270 | Tragic $36,920 |
| Nicaraguans | 0.3 /100 | #271 | Tragic $36,904 |
| Immigrants | Dominican Republic | 0.3 /100 | #272 | Tragic $36,857 |
| Immigrants | Laos | 0.3 /100 | #273 | Tragic $36,841 |
| Immigrants | El Salvador | 0.2 /100 | #274 | Tragic $36,673 |
| Africans | 0.1 /100 | #275 | Tragic $36,530 |
| Central Americans | 0.1 /100 | #276 | Tragic $36,492 |
| Marshallese | 0.1 /100 | #277 | Tragic $36,459 |
| U.S. Virgin Islanders | 0.1 /100 | #278 | Tragic $36,424 |
| Immigrants | Caribbean | 0.1 /100 | #279 | Tragic $36,414 |
| Iroquois | 0.1 /100 | #280 | Tragic $36,408 |
| Spanish Americans | 0.1 /100 | #281 | Tragic $36,391 |
| Haitians | 0.1 /100 | #282 | Tragic $36,374 |
Demographics Similar to Immigrants from Bangladesh by Median Female Earnings
In terms of median female earnings, the demographic groups most similar to Immigrants from Bangladesh are Immigrants from Ghana ($39,894, a difference of 0.040%), Luxembourger ($39,891, a difference of 0.050%), Immigrants from Peru ($39,871, a difference of 0.10%), Immigrants from Saudi Arabia ($39,952, a difference of 0.11%), and Kenyan ($39,860, a difference of 0.12%).
| Demographics | Rating | Rank | Median Female Earnings |
| Immigrants | Senegal | 72.2 /100 | #158 | Good $40,157 |
| Immigrants | Vietnam | 72.0 /100 | #159 | Good $40,153 |
| Inupiat | 68.9 /100 | #160 | Good $40,080 |
| Alsatians | 68.0 /100 | #161 | Good $40,060 |
| South American Indians | 66.1 /100 | #162 | Good $40,019 |
| Lebanese | 65.5 /100 | #163 | Good $40,006 |
| Immigrants | Saudi Arabia | 62.9 /100 | #164 | Good $39,952 |
| Immigrants | Bangladesh | 60.8 /100 | #165 | Good $39,910 |
| Immigrants | Ghana | 60.0 /100 | #166 | Good $39,894 |
| Luxembourgers | 59.9 /100 | #167 | Average $39,891 |
| Immigrants | Peru | 58.9 /100 | #168 | Average $39,871 |
| Kenyans | 58.4 /100 | #169 | Average $39,860 |
| Slovenes | 56.2 /100 | #170 | Average $39,817 |
| Immigrants | Portugal | 54.7 /100 | #171 | Average $39,788 |
| British | 53.8 /100 | #172 | Average $39,772 |