Pima vs Slovak Median Female Earnings
COMPARE
Pima
Slovak
Median Female Earnings
Median Female Earnings Comparison
Pima
Slovaks
$35,326
MEDIAN FEMALE EARNINGS
0.0/ 100
METRIC RATING
301st/ 347
METRIC RANK
$39,029
MEDIAN FEMALE EARNINGS
19.9/ 100
METRIC RATING
202nd/ 347
METRIC RANK
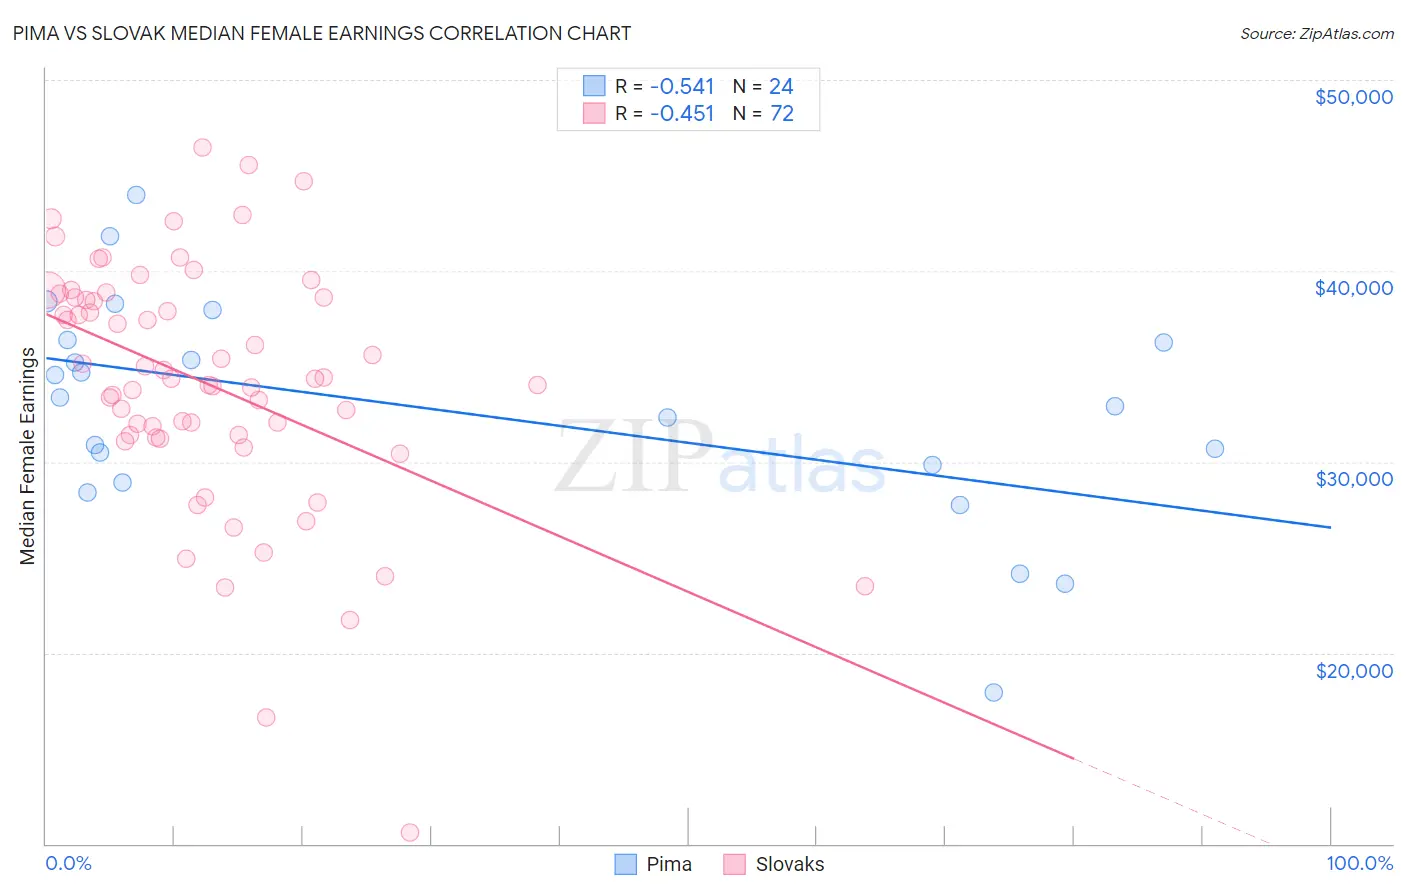
Pima vs Slovak Median Female Earnings Correlation Chart
The statistical analysis conducted on geographies consisting of 61,524,471 people shows a substantial negative correlation between the proportion of Pima and median female earnings in the United States with a correlation coefficient (R) of -0.541 and weighted average of $35,326. Similarly, the statistical analysis conducted on geographies consisting of 397,593,925 people shows a moderate negative correlation between the proportion of Slovaks and median female earnings in the United States with a correlation coefficient (R) of -0.451 and weighted average of $39,029, a difference of 10.5%.
Median Female Earnings Correlation Summary
| Measurement | Pima | Slovak |
| Minimum | $17,917 | $10,580 |
| Maximum | $43,952 | $46,470 |
| Range | $26,035 | $35,890 |
| Mean | $32,676 | $34,113 |
| Median | $33,171 | $34,365 |
| Interquartile 25% (IQ1) | $29,398 | $31,338 |
| Interquartile 75% (IQ3) | $36,333 | $38,606 |
| Interquartile Range (IQR) | $6,935 | $7,268 |
| Standard Deviation (Sample) | $5,900 | $6,495 |
| Standard Deviation (Population) | $5,776 | $6,450 |
Similar Demographics by Median Female Earnings
Demographics Similar to Pima by Median Female Earnings
In terms of median female earnings, the demographic groups most similar to Pima are Black/African American ($35,315, a difference of 0.030%), Immigrants from Latin America ($35,307, a difference of 0.050%), Yuman ($35,377, a difference of 0.14%), Crow ($35,266, a difference of 0.17%), and Immigrants from Guatemala ($35,444, a difference of 0.33%).
| Demographics | Rating | Rank | Median Female Earnings |
| Cheyenne | 0.0 /100 | #294 | Tragic $35,673 |
| Comanche | 0.0 /100 | #295 | Tragic $35,661 |
| Mexican American Indians | 0.0 /100 | #296 | Tragic $35,629 |
| Hmong | 0.0 /100 | #297 | Tragic $35,498 |
| Immigrants | Micronesia | 0.0 /100 | #298 | Tragic $35,477 |
| Immigrants | Guatemala | 0.0 /100 | #299 | Tragic $35,444 |
| Yuman | 0.0 /100 | #300 | Tragic $35,377 |
| Pima | 0.0 /100 | #301 | Tragic $35,326 |
| Blacks/African Americans | 0.0 /100 | #302 | Tragic $35,315 |
| Immigrants | Latin America | 0.0 /100 | #303 | Tragic $35,307 |
| Crow | 0.0 /100 | #304 | Tragic $35,266 |
| Bahamians | 0.0 /100 | #305 | Tragic $35,125 |
| Fijians | 0.0 /100 | #306 | Tragic $35,114 |
| Sioux | 0.0 /100 | #307 | Tragic $35,063 |
| Immigrants | Bahamas | 0.0 /100 | #308 | Tragic $35,027 |
Demographics Similar to Slovaks by Median Female Earnings
In terms of median female earnings, the demographic groups most similar to Slovaks are Immigrants from Panama ($39,049, a difference of 0.050%), Panamanian ($39,049, a difference of 0.050%), Czech ($38,992, a difference of 0.090%), Icelander ($39,109, a difference of 0.21%), and Immigrants from Uruguay ($38,945, a difference of 0.22%).
| Demographics | Rating | Rank | Median Female Earnings |
| Uruguayans | 27.3 /100 | #195 | Fair $39,228 |
| Immigrants | Costa Rica | 25.6 /100 | #196 | Fair $39,186 |
| Assyrians/Chaldeans/Syriacs | 24.6 /100 | #197 | Fair $39,159 |
| Ecuadorians | 23.0 /100 | #198 | Fair $39,117 |
| Icelanders | 22.7 /100 | #199 | Fair $39,109 |
| Immigrants | Panama | 20.6 /100 | #200 | Fair $39,049 |
| Panamanians | 20.6 /100 | #201 | Fair $39,049 |
| Slovaks | 19.9 /100 | #202 | Poor $39,029 |
| Czechs | 18.7 /100 | #203 | Poor $38,992 |
| Immigrants | Uruguay | 17.3 /100 | #204 | Poor $38,945 |
| Immigrants | Colombia | 16.3 /100 | #205 | Poor $38,913 |
| Immigrants | Bosnia and Herzegovina | 15.6 /100 | #206 | Poor $38,886 |
| Immigrants | Cambodia | 14.2 /100 | #207 | Poor $38,833 |
| Immigrants | Thailand | 13.6 /100 | #208 | Poor $38,810 |
| Norwegians | 13.4 /100 | #209 | Poor $38,802 |