Pima vs Immigrants from Bangladesh Female Poverty Among 18-24 Year Olds
COMPARE
Pima
Immigrants from Bangladesh
Female Poverty Among 18-24 Year Olds
Female Poverty Among 18-24 Year Olds Comparison
Pima
Immigrants from Bangladesh
28.4%
FEMALE POVERTY AMONG 18-24 YEAR OLDS
0.0/ 100
METRIC RATING
339th/ 347
METRIC RANK
21.8%
FEMALE POVERTY AMONG 18-24 YEAR OLDS
0.1/ 100
METRIC RATING
275th/ 347
METRIC RANK
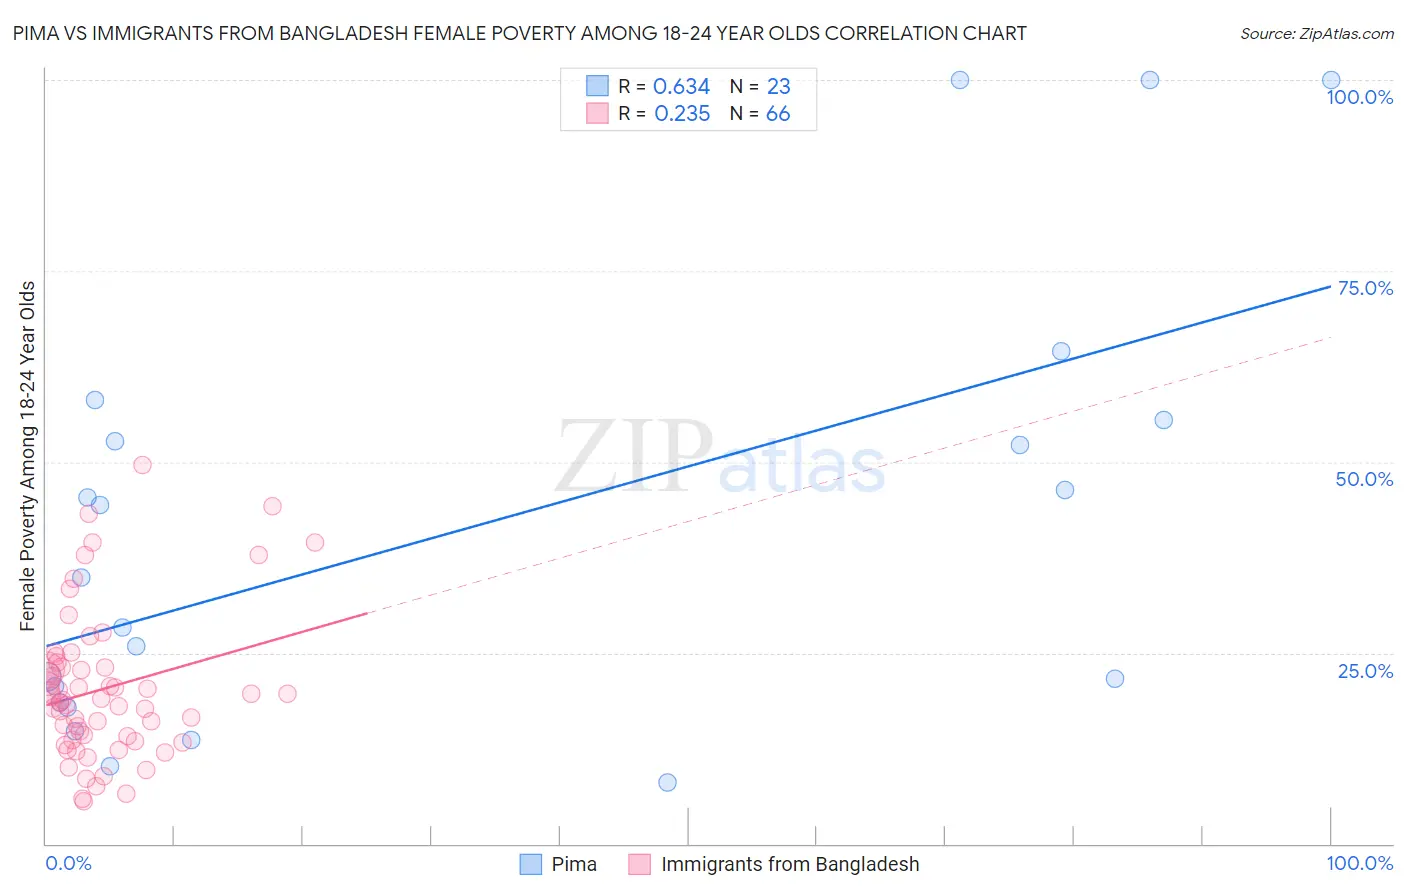
Pima vs Immigrants from Bangladesh Female Poverty Among 18-24 Year Olds Correlation Chart
The statistical analysis conducted on geographies consisting of 61,293,742 people shows a significant positive correlation between the proportion of Pima and poverty level among females between the ages 18 and 24 in the United States with a correlation coefficient (R) of 0.634 and weighted average of 28.4%. Similarly, the statistical analysis conducted on geographies consisting of 201,521,448 people shows a weak positive correlation between the proportion of Immigrants from Bangladesh and poverty level among females between the ages 18 and 24 in the United States with a correlation coefficient (R) of 0.235 and weighted average of 21.8%, a difference of 30.4%.
Female Poverty Among 18-24 Year Olds Correlation Summary
| Measurement | Pima | Immigrants from Bangladesh |
| Minimum | 8.0% | 5.6% |
| Maximum | 100.0% | 49.6% |
| Range | 92.0% | 44.0% |
| Mean | 41.5% | 20.3% |
| Median | 34.9% | 19.0% |
| Interquartile 25% (IQ1) | 18.5% | 13.6% |
| Interquartile 75% (IQ3) | 55.5% | 23.1% |
| Interquartile Range (IQR) | 37.0% | 9.5% |
| Standard Deviation (Sample) | 28.5% | 9.6% |
| Standard Deviation (Population) | 27.9% | 9.6% |
Similar Demographics by Female Poverty Among 18-24 Year Olds
Demographics Similar to Pima by Female Poverty Among 18-24 Year Olds
In terms of female poverty among 18-24 year olds, the demographic groups most similar to Pima are Sioux (28.6%, a difference of 0.55%), Hopi (28.2%, a difference of 0.72%), Cheyenne (28.1%, a difference of 0.94%), Colville (29.0%, a difference of 2.1%), and Kiowa (29.2%, a difference of 2.9%).
| Demographics | Rating | Rank | Female Poverty Among 18-24 Year Olds |
| Houma | 0.0 /100 | #332 | Tragic 26.2% |
| Apache | 0.0 /100 | #333 | Tragic 26.3% |
| Pueblo | 0.0 /100 | #334 | Tragic 26.9% |
| Yup'ik | 0.0 /100 | #335 | Tragic 27.0% |
| Immigrants | Yemen | 0.0 /100 | #336 | Tragic 27.5% |
| Cheyenne | 0.0 /100 | #337 | Tragic 28.1% |
| Hopi | 0.0 /100 | #338 | Tragic 28.2% |
| Pima | 0.0 /100 | #339 | Tragic 28.4% |
| Sioux | 0.0 /100 | #340 | Tragic 28.6% |
| Colville | 0.0 /100 | #341 | Tragic 29.0% |
| Kiowa | 0.0 /100 | #342 | Tragic 29.2% |
| Puerto Ricans | 0.0 /100 | #343 | Tragic 29.8% |
| Navajo | 0.0 /100 | #344 | Tragic 30.3% |
| Tohono O'odham | 0.0 /100 | #345 | Tragic 31.0% |
| Lumbee | 0.0 /100 | #346 | Tragic 31.1% |
Demographics Similar to Immigrants from Bangladesh by Female Poverty Among 18-24 Year Olds
In terms of female poverty among 18-24 year olds, the demographic groups most similar to Immigrants from Bangladesh are Bahamian (21.8%, a difference of 0.020%), Immigrants from Honduras (21.8%, a difference of 0.040%), Immigrants from Switzerland (21.8%, a difference of 0.15%), Yaqui (21.9%, a difference of 0.41%), and New Zealander (21.7%, a difference of 0.43%).
| Demographics | Rating | Rank | Female Poverty Among 18-24 Year Olds |
| Immigrants | Burma/Myanmar | 0.2 /100 | #268 | Tragic 21.6% |
| Celtics | 0.2 /100 | #269 | Tragic 21.6% |
| Mongolians | 0.2 /100 | #270 | Tragic 21.6% |
| Scotch-Irish | 0.2 /100 | #271 | Tragic 21.6% |
| Basques | 0.2 /100 | #272 | Tragic 21.7% |
| New Zealanders | 0.2 /100 | #273 | Tragic 21.7% |
| Immigrants | Honduras | 0.1 /100 | #274 | Tragic 21.8% |
| Immigrants | Bangladesh | 0.1 /100 | #275 | Tragic 21.8% |
| Bahamians | 0.1 /100 | #276 | Tragic 21.8% |
| Immigrants | Switzerland | 0.1 /100 | #277 | Tragic 21.8% |
| Yaqui | 0.1 /100 | #278 | Tragic 21.9% |
| Spanish Americans | 0.1 /100 | #279 | Tragic 21.9% |
| Immigrants | Dominica | 0.1 /100 | #280 | Tragic 21.9% |
| Immigrants | Dominican Republic | 0.1 /100 | #281 | Tragic 21.9% |
| Bermudans | 0.1 /100 | #282 | Tragic 21.9% |