Pima vs West Indian Median Female Earnings
COMPARE
Pima
West Indian
Median Female Earnings
Median Female Earnings Comparison
Pima
West Indians
$35,326
MEDIAN FEMALE EARNINGS
0.0/ 100
METRIC RATING
301st/ 347
METRIC RANK
$40,317
MEDIAN FEMALE EARNINGS
78.4/ 100
METRIC RATING
152nd/ 347
METRIC RANK
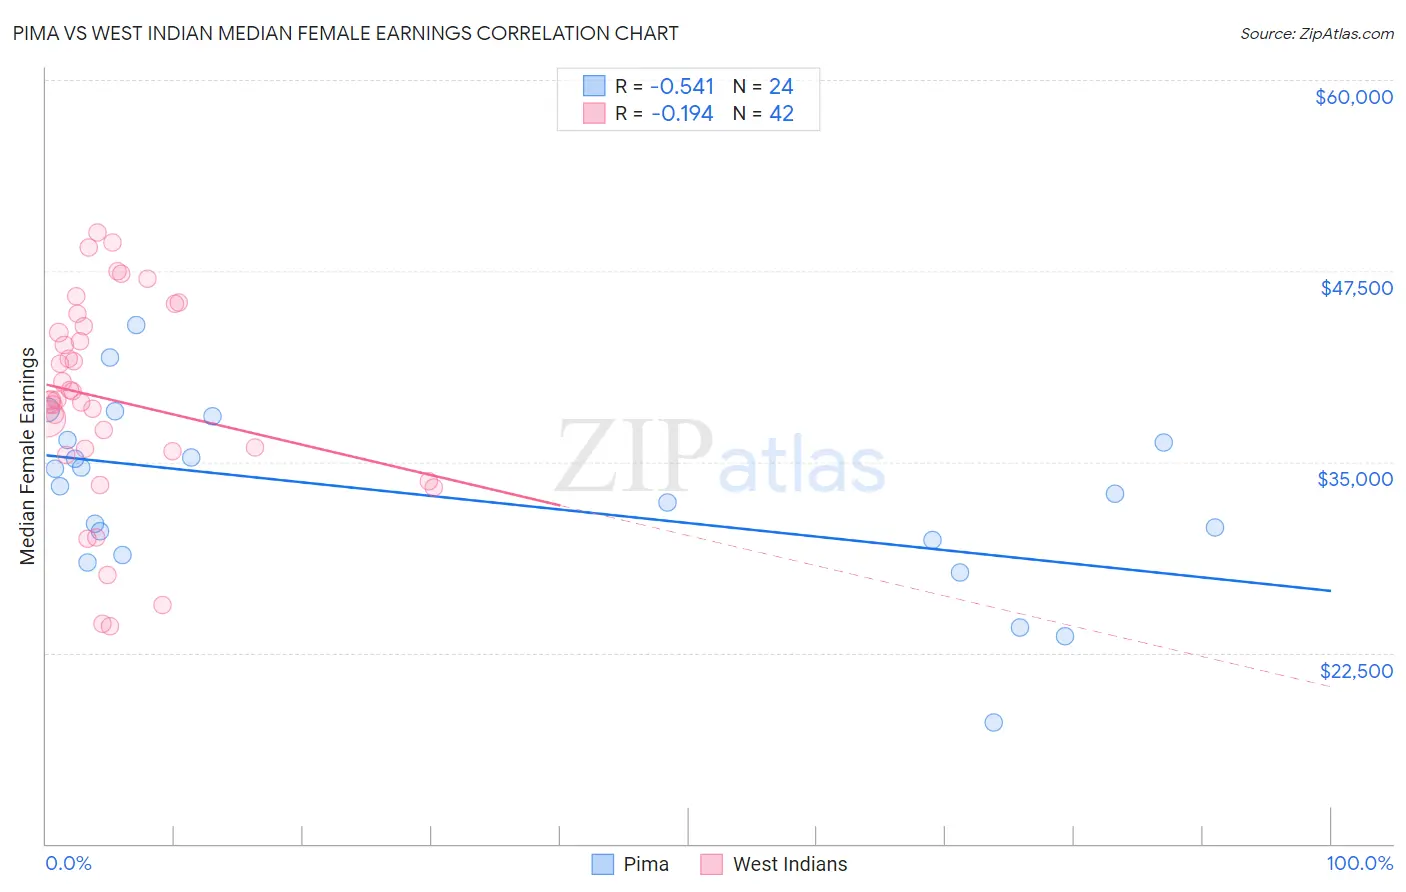
Pima vs West Indian Median Female Earnings Correlation Chart
The statistical analysis conducted on geographies consisting of 61,524,471 people shows a substantial negative correlation between the proportion of Pima and median female earnings in the United States with a correlation coefficient (R) of -0.541 and weighted average of $35,326. Similarly, the statistical analysis conducted on geographies consisting of 253,995,323 people shows a poor negative correlation between the proportion of West Indians and median female earnings in the United States with a correlation coefficient (R) of -0.194 and weighted average of $40,317, a difference of 14.1%.
Median Female Earnings Correlation Summary
| Measurement | Pima | West Indian |
| Minimum | $17,917 | $24,276 |
| Maximum | $43,952 | $50,049 |
| Range | $26,035 | $25,773 |
| Mean | $32,676 | $39,058 |
| Median | $33,171 | $39,050 |
| Interquartile 25% (IQ1) | $29,398 | $35,688 |
| Interquartile 75% (IQ3) | $36,333 | $43,912 |
| Interquartile Range (IQR) | $6,935 | $8,224 |
| Standard Deviation (Sample) | $5,900 | $6,683 |
| Standard Deviation (Population) | $5,776 | $6,603 |
Similar Demographics by Median Female Earnings
Demographics Similar to Pima by Median Female Earnings
In terms of median female earnings, the demographic groups most similar to Pima are Black/African American ($35,315, a difference of 0.030%), Immigrants from Latin America ($35,307, a difference of 0.050%), Yuman ($35,377, a difference of 0.14%), Crow ($35,266, a difference of 0.17%), and Immigrants from Guatemala ($35,444, a difference of 0.33%).
| Demographics | Rating | Rank | Median Female Earnings |
| Cheyenne | 0.0 /100 | #294 | Tragic $35,673 |
| Comanche | 0.0 /100 | #295 | Tragic $35,661 |
| Mexican American Indians | 0.0 /100 | #296 | Tragic $35,629 |
| Hmong | 0.0 /100 | #297 | Tragic $35,498 |
| Immigrants | Micronesia | 0.0 /100 | #298 | Tragic $35,477 |
| Immigrants | Guatemala | 0.0 /100 | #299 | Tragic $35,444 |
| Yuman | 0.0 /100 | #300 | Tragic $35,377 |
| Pima | 0.0 /100 | #301 | Tragic $35,326 |
| Blacks/African Americans | 0.0 /100 | #302 | Tragic $35,315 |
| Immigrants | Latin America | 0.0 /100 | #303 | Tragic $35,307 |
| Crow | 0.0 /100 | #304 | Tragic $35,266 |
| Bahamians | 0.0 /100 | #305 | Tragic $35,125 |
| Fijians | 0.0 /100 | #306 | Tragic $35,114 |
| Sioux | 0.0 /100 | #307 | Tragic $35,063 |
| Immigrants | Bahamas | 0.0 /100 | #308 | Tragic $35,027 |
Demographics Similar to West Indians by Median Female Earnings
In terms of median female earnings, the demographic groups most similar to West Indians are British West Indian ($40,299, a difference of 0.040%), Immigrants from Oceania ($40,297, a difference of 0.050%), Immigrants from Armenia ($40,340, a difference of 0.060%), Immigrants from Cameroon ($40,354, a difference of 0.090%), and Immigrants from Chile ($40,353, a difference of 0.090%).
| Demographics | Rating | Rank | Median Female Earnings |
| Brazilians | 83.6 /100 | #145 | Excellent $40,483 |
| Ghanaians | 82.1 /100 | #146 | Excellent $40,429 |
| Vietnamese | 80.4 /100 | #147 | Excellent $40,377 |
| Poles | 80.2 /100 | #148 | Excellent $40,371 |
| Immigrants | Cameroon | 79.7 /100 | #149 | Good $40,354 |
| Immigrants | Chile | 79.6 /100 | #150 | Good $40,353 |
| Immigrants | Armenia | 79.2 /100 | #151 | Good $40,340 |
| West Indians | 78.4 /100 | #152 | Good $40,317 |
| British West Indians | 77.7 /100 | #153 | Good $40,299 |
| Immigrants | Oceania | 77.6 /100 | #154 | Good $40,297 |
| Immigrants | Africa | 76.2 /100 | #155 | Good $40,257 |
| Peruvians | 75.3 /100 | #156 | Good $40,234 |
| Portuguese | 73.0 /100 | #157 | Good $40,177 |
| Immigrants | Senegal | 72.2 /100 | #158 | Good $40,157 |
| Immigrants | Vietnam | 72.0 /100 | #159 | Good $40,153 |