Pima vs Immigrants from Albania Median Female Earnings
COMPARE
Pima
Immigrants from Albania
Median Female Earnings
Median Female Earnings Comparison
Pima
Immigrants from Albania
$35,326
MEDIAN FEMALE EARNINGS
0.0/ 100
METRIC RATING
301st/ 347
METRIC RANK
$42,388
MEDIAN FEMALE EARNINGS
99.6/ 100
METRIC RATING
77th/ 347
METRIC RANK
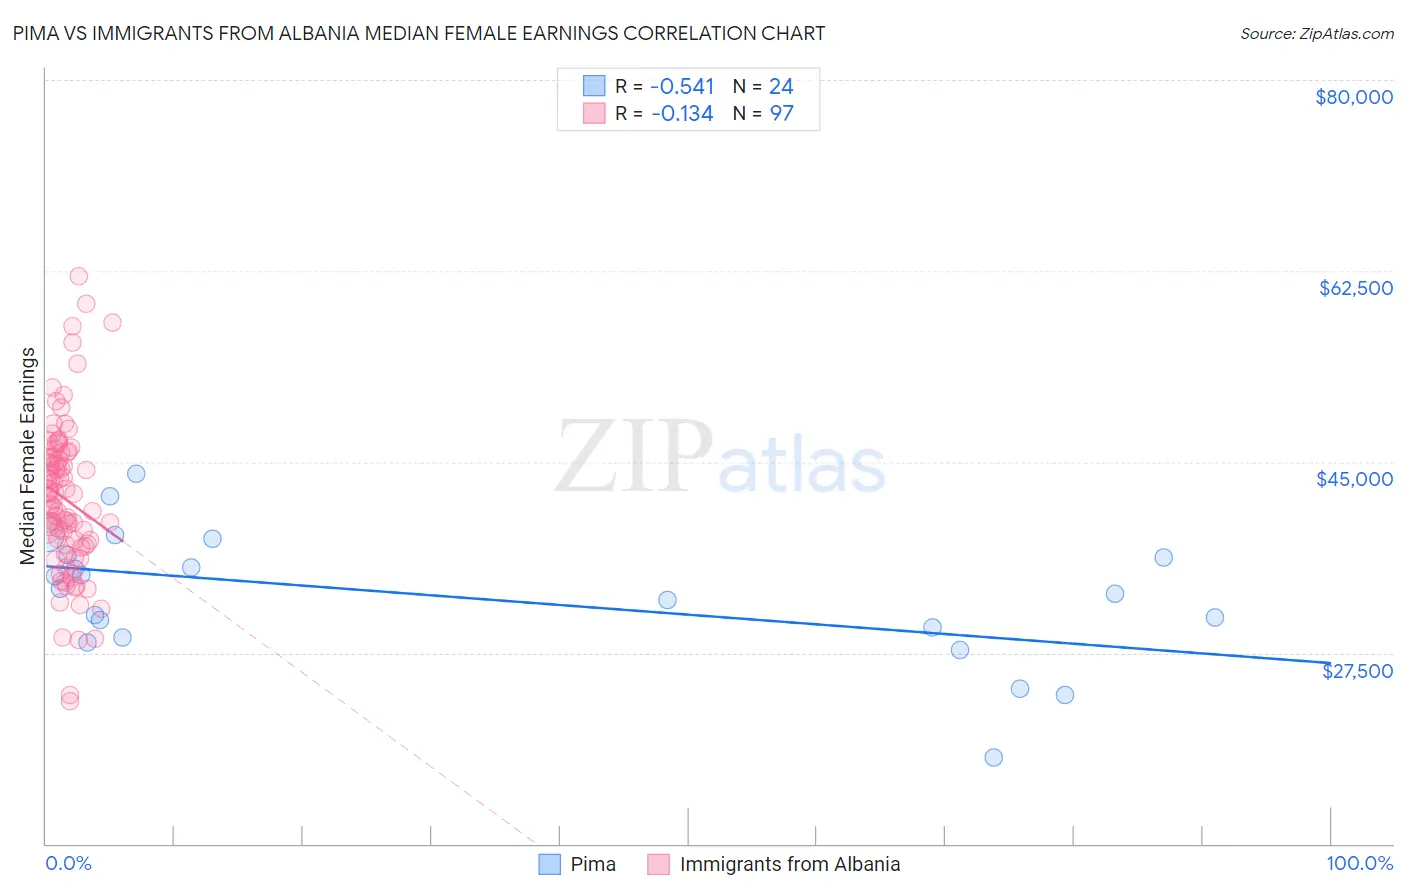
Pima vs Immigrants from Albania Median Female Earnings Correlation Chart
The statistical analysis conducted on geographies consisting of 61,524,471 people shows a substantial negative correlation between the proportion of Pima and median female earnings in the United States with a correlation coefficient (R) of -0.541 and weighted average of $35,326. Similarly, the statistical analysis conducted on geographies consisting of 119,358,863 people shows a poor negative correlation between the proportion of Immigrants from Albania and median female earnings in the United States with a correlation coefficient (R) of -0.134 and weighted average of $42,388, a difference of 20.0%.
Median Female Earnings Correlation Summary
| Measurement | Pima | Immigrants from Albania |
| Minimum | $17,917 | $23,074 |
| Maximum | $43,952 | $62,011 |
| Range | $26,035 | $38,937 |
| Mean | $32,676 | $41,579 |
| Median | $33,171 | $41,555 |
| Interquartile 25% (IQ1) | $29,398 | $37,330 |
| Interquartile 75% (IQ3) | $36,333 | $45,624 |
| Interquartile Range (IQR) | $6,935 | $8,295 |
| Standard Deviation (Sample) | $5,900 | $7,093 |
| Standard Deviation (Population) | $5,776 | $7,056 |
Similar Demographics by Median Female Earnings
Demographics Similar to Pima by Median Female Earnings
In terms of median female earnings, the demographic groups most similar to Pima are Black/African American ($35,315, a difference of 0.030%), Immigrants from Latin America ($35,307, a difference of 0.050%), Yuman ($35,377, a difference of 0.14%), Crow ($35,266, a difference of 0.17%), and Immigrants from Guatemala ($35,444, a difference of 0.33%).
| Demographics | Rating | Rank | Median Female Earnings |
| Cheyenne | 0.0 /100 | #294 | Tragic $35,673 |
| Comanche | 0.0 /100 | #295 | Tragic $35,661 |
| Mexican American Indians | 0.0 /100 | #296 | Tragic $35,629 |
| Hmong | 0.0 /100 | #297 | Tragic $35,498 |
| Immigrants | Micronesia | 0.0 /100 | #298 | Tragic $35,477 |
| Immigrants | Guatemala | 0.0 /100 | #299 | Tragic $35,444 |
| Yuman | 0.0 /100 | #300 | Tragic $35,377 |
| Pima | 0.0 /100 | #301 | Tragic $35,326 |
| Blacks/African Americans | 0.0 /100 | #302 | Tragic $35,315 |
| Immigrants | Latin America | 0.0 /100 | #303 | Tragic $35,307 |
| Crow | 0.0 /100 | #304 | Tragic $35,266 |
| Bahamians | 0.0 /100 | #305 | Tragic $35,125 |
| Fijians | 0.0 /100 | #306 | Tragic $35,114 |
| Sioux | 0.0 /100 | #307 | Tragic $35,063 |
| Immigrants | Bahamas | 0.0 /100 | #308 | Tragic $35,027 |
Demographics Similar to Immigrants from Albania by Median Female Earnings
In terms of median female earnings, the demographic groups most similar to Immigrants from Albania are Immigrants from Kazakhstan ($42,386, a difference of 0.0%), Greek ($42,336, a difference of 0.12%), New Zealander ($42,446, a difference of 0.14%), Immigrants from Italy ($42,446, a difference of 0.14%), and Immigrants from Moldova ($42,304, a difference of 0.20%).
| Demographics | Rating | Rank | Median Female Earnings |
| Immigrants | Ethiopia | 99.8 /100 | #70 | Exceptional $42,744 |
| Immigrants | Romania | 99.8 /100 | #71 | Exceptional $42,718 |
| Albanians | 99.8 /100 | #72 | Exceptional $42,584 |
| Mongolians | 99.7 /100 | #73 | Exceptional $42,542 |
| Immigrants | South Africa | 99.7 /100 | #74 | Exceptional $42,508 |
| New Zealanders | 99.7 /100 | #75 | Exceptional $42,446 |
| Immigrants | Italy | 99.7 /100 | #76 | Exceptional $42,446 |
| Immigrants | Albania | 99.6 /100 | #77 | Exceptional $42,388 |
| Immigrants | Kazakhstan | 99.6 /100 | #78 | Exceptional $42,386 |
| Greeks | 99.6 /100 | #79 | Exceptional $42,336 |
| Immigrants | Moldova | 99.6 /100 | #80 | Exceptional $42,304 |
| Immigrants | Southern Europe | 99.5 /100 | #81 | Exceptional $42,275 |
| Immigrants | Morocco | 99.5 /100 | #82 | Exceptional $42,229 |
| Immigrants | Sierra Leone | 99.5 /100 | #83 | Exceptional $42,214 |
| Armenians | 99.5 /100 | #84 | Exceptional $42,212 |