Paiute vs Russian Wage/Income Gap
COMPARE
Paiute
Russian
Wage/Income Gap
Wage/Income Gap Comparison
Paiute
Russians
25.5%
WAGE/INCOME GAP
62.9/ 100
METRIC RATING
167th/ 347
METRIC RANK
28.0%
WAGE/INCOME GAP
0.5/ 100
METRIC RATING
280th/ 347
METRIC RANK
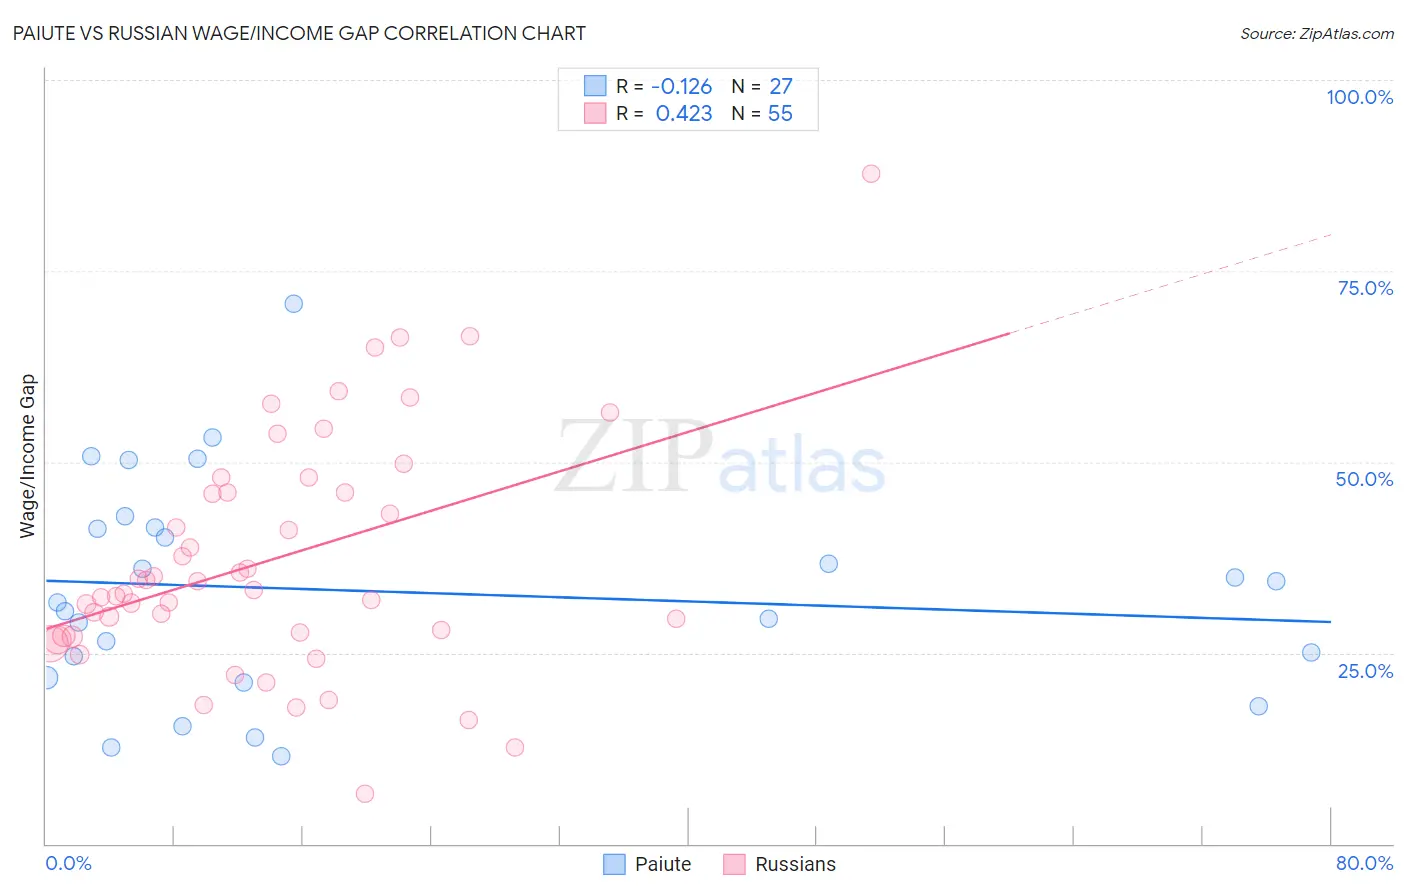
Paiute vs Russian Wage/Income Gap Correlation Chart
The statistical analysis conducted on geographies consisting of 58,365,830 people shows a poor negative correlation between the proportion of Paiute and wage/income gap percentage in the United States with a correlation coefficient (R) of -0.126 and weighted average of 25.5%. Similarly, the statistical analysis conducted on geographies consisting of 511,171,536 people shows a moderate positive correlation between the proportion of Russians and wage/income gap percentage in the United States with a correlation coefficient (R) of 0.423 and weighted average of 28.0%, a difference of 9.6%.
Wage/Income Gap Correlation Summary
| Measurement | Paiute | Russian |
| Minimum | 11.5% | 6.5% |
| Maximum | 70.8% | 87.7% |
| Range | 59.2% | 81.2% |
| Mean | 33.1% | 37.1% |
| Median | 31.6% | 33.2% |
| Interquartile 25% (IQ1) | 21.7% | 27.2% |
| Interquartile 75% (IQ3) | 41.4% | 46.0% |
| Interquartile Range (IQR) | 19.6% | 18.8% |
| Standard Deviation (Sample) | 14.3% | 15.5% |
| Standard Deviation (Population) | 14.0% | 15.3% |
Similar Demographics by Wage/Income Gap
Demographics Similar to Paiute by Wage/Income Gap
In terms of wage/income gap, the demographic groups most similar to Paiute are Seminole (25.6%, a difference of 0.020%), Immigrants from Ukraine (25.5%, a difference of 0.060%), Immigrants from Hong Kong (25.5%, a difference of 0.070%), Peruvian (25.6%, a difference of 0.20%), and Immigrants from Oceania (25.6%, a difference of 0.37%).
| Demographics | Rating | Rank | Wage/Income Gap |
| French American Indians | 72.5 /100 | #160 | Good 25.4% |
| Albanians | 69.4 /100 | #161 | Good 25.4% |
| Shoshone | 69.0 /100 | #162 | Good 25.4% |
| Native Hawaiians | 69.0 /100 | #163 | Good 25.4% |
| Koreans | 68.6 /100 | #164 | Good 25.4% |
| Immigrants | Hong Kong | 64.0 /100 | #165 | Good 25.5% |
| Immigrants | Ukraine | 63.8 /100 | #166 | Good 25.5% |
| Paiute | 62.9 /100 | #167 | Good 25.5% |
| Seminole | 62.6 /100 | #168 | Good 25.6% |
| Peruvians | 60.1 /100 | #169 | Good 25.6% |
| Immigrants | Oceania | 57.5 /100 | #170 | Average 25.6% |
| Immigrants | Greece | 56.6 /100 | #171 | Average 25.7% |
| Immigrants | Chile | 53.2 /100 | #172 | Average 25.7% |
| Immigrants | Belarus | 52.9 /100 | #173 | Average 25.7% |
| Alaskan Athabascans | 50.0 /100 | #174 | Average 25.8% |
Demographics Similar to Russians by Wage/Income Gap
In terms of wage/income gap, the demographic groups most similar to Russians are Burmese (28.0%, a difference of 0.050%), South African (28.0%, a difference of 0.080%), Romanian (28.0%, a difference of 0.15%), French Canadian (28.1%, a difference of 0.26%), and Immigrants from Sweden (28.1%, a difference of 0.26%).
| Demographics | Rating | Rank | Wage/Income Gap |
| Bulgarians | 0.7 /100 | #273 | Tragic 27.8% |
| Americans | 0.7 /100 | #274 | Tragic 27.8% |
| Immigrants | Japan | 0.7 /100 | #275 | Tragic 27.9% |
| Lebanese | 0.7 /100 | #276 | Tragic 27.9% |
| Latvians | 0.7 /100 | #277 | Tragic 27.9% |
| Immigrants | England | 0.6 /100 | #278 | Tragic 27.9% |
| Romanians | 0.5 /100 | #279 | Tragic 28.0% |
| Russians | 0.5 /100 | #280 | Tragic 28.0% |
| Burmese | 0.5 /100 | #281 | Tragic 28.0% |
| South Africans | 0.5 /100 | #282 | Tragic 28.0% |
| French Canadians | 0.4 /100 | #283 | Tragic 28.1% |
| Immigrants | Sweden | 0.4 /100 | #284 | Tragic 28.1% |
| Italians | 0.4 /100 | #285 | Tragic 28.1% |
| Immigrants | Austria | 0.4 /100 | #286 | Tragic 28.1% |
| Okinawans | 0.4 /100 | #287 | Tragic 28.1% |