Paiute vs Immigrants from Colombia Wage/Income Gap
COMPARE
Paiute
Immigrants from Colombia
Wage/Income Gap
Wage/Income Gap Comparison
Paiute
Immigrants from Colombia
25.5%
WAGE/INCOME GAP
62.9/ 100
METRIC RATING
167th/ 347
METRIC RANK
24.3%
WAGE/INCOME GAP
97.0/ 100
METRIC RATING
112th/ 347
METRIC RANK
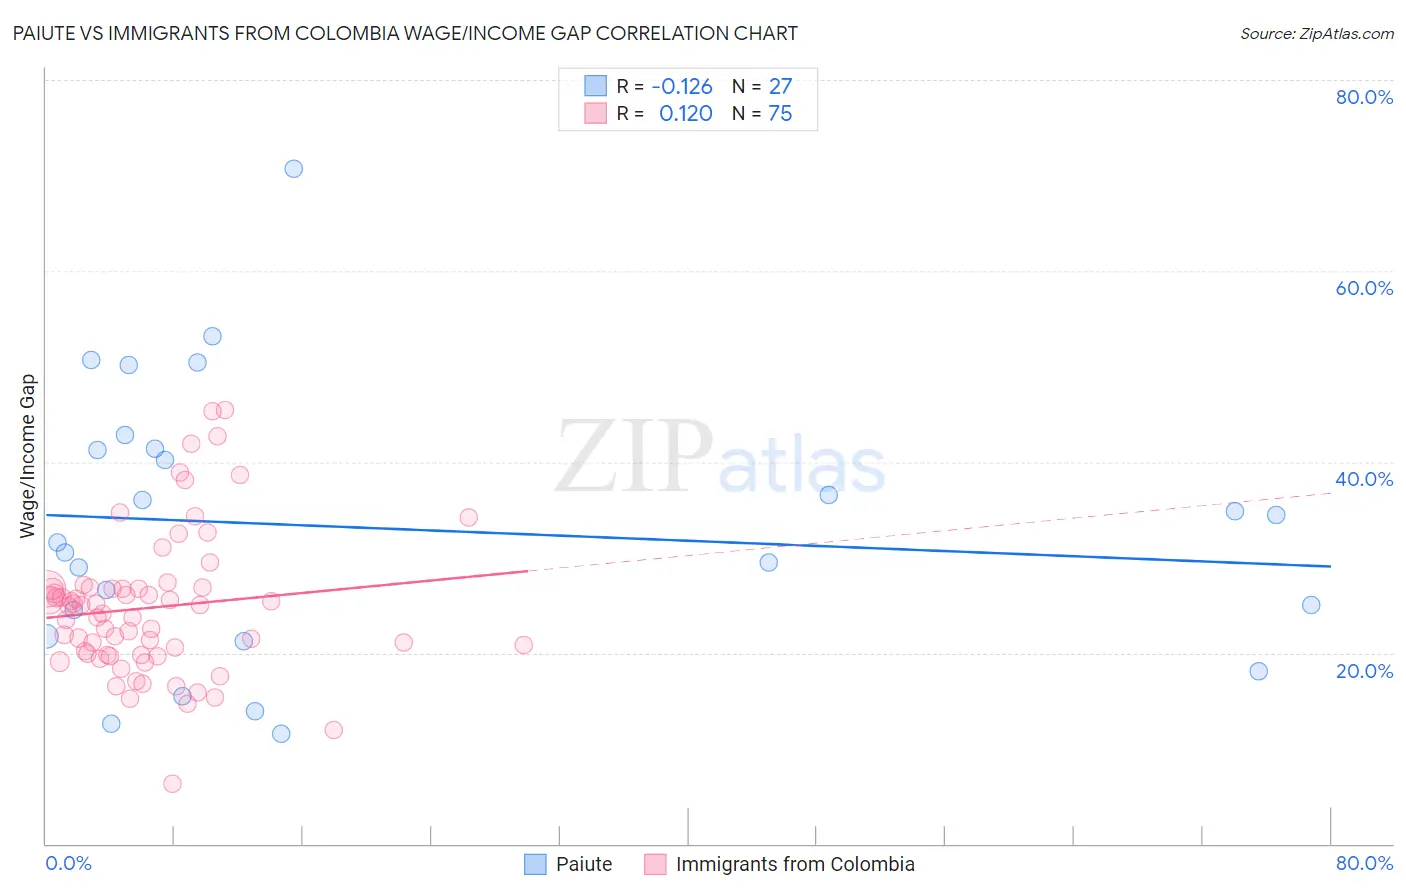
Paiute vs Immigrants from Colombia Wage/Income Gap Correlation Chart
The statistical analysis conducted on geographies consisting of 58,365,830 people shows a poor negative correlation between the proportion of Paiute and wage/income gap percentage in the United States with a correlation coefficient (R) of -0.126 and weighted average of 25.5%. Similarly, the statistical analysis conducted on geographies consisting of 378,481,077 people shows a poor positive correlation between the proportion of Immigrants from Colombia and wage/income gap percentage in the United States with a correlation coefficient (R) of 0.120 and weighted average of 24.3%, a difference of 5.1%.
Wage/Income Gap Correlation Summary
| Measurement | Paiute | Immigrants from Colombia |
| Minimum | 11.5% | 6.3% |
| Maximum | 70.8% | 45.5% |
| Range | 59.2% | 39.1% |
| Mean | 33.1% | 24.7% |
| Median | 31.6% | 24.8% |
| Interquartile 25% (IQ1) | 21.7% | 19.7% |
| Interquartile 75% (IQ3) | 41.4% | 26.7% |
| Interquartile Range (IQR) | 19.6% | 7.0% |
| Standard Deviation (Sample) | 14.3% | 7.5% |
| Standard Deviation (Population) | 14.0% | 7.4% |
Similar Demographics by Wage/Income Gap
Demographics Similar to Paiute by Wage/Income Gap
In terms of wage/income gap, the demographic groups most similar to Paiute are Seminole (25.6%, a difference of 0.020%), Immigrants from Ukraine (25.5%, a difference of 0.060%), Immigrants from Hong Kong (25.5%, a difference of 0.070%), Peruvian (25.6%, a difference of 0.20%), and Immigrants from Oceania (25.6%, a difference of 0.37%).
| Demographics | Rating | Rank | Wage/Income Gap |
| French American Indians | 72.5 /100 | #160 | Good 25.4% |
| Albanians | 69.4 /100 | #161 | Good 25.4% |
| Shoshone | 69.0 /100 | #162 | Good 25.4% |
| Native Hawaiians | 69.0 /100 | #163 | Good 25.4% |
| Koreans | 68.6 /100 | #164 | Good 25.4% |
| Immigrants | Hong Kong | 64.0 /100 | #165 | Good 25.5% |
| Immigrants | Ukraine | 63.8 /100 | #166 | Good 25.5% |
| Paiute | 62.9 /100 | #167 | Good 25.5% |
| Seminole | 62.6 /100 | #168 | Good 25.6% |
| Peruvians | 60.1 /100 | #169 | Good 25.6% |
| Immigrants | Oceania | 57.5 /100 | #170 | Average 25.6% |
| Immigrants | Greece | 56.6 /100 | #171 | Average 25.7% |
| Immigrants | Chile | 53.2 /100 | #172 | Average 25.7% |
| Immigrants | Belarus | 52.9 /100 | #173 | Average 25.7% |
| Alaskan Athabascans | 50.0 /100 | #174 | Average 25.8% |
Demographics Similar to Immigrants from Colombia by Wage/Income Gap
In terms of wage/income gap, the demographic groups most similar to Immigrants from Colombia are Sioux (24.3%, a difference of 0.050%), Panamanian (24.4%, a difference of 0.25%), Immigrants from Kenya (24.4%, a difference of 0.31%), Soviet Union (24.2%, a difference of 0.40%), and Alaska Native (24.4%, a difference of 0.48%).
| Demographics | Rating | Rank | Wage/Income Gap |
| Moroccans | 98.6 /100 | #105 | Exceptional 24.0% |
| Sudanese | 98.6 /100 | #106 | Exceptional 24.0% |
| Yaqui | 98.4 /100 | #107 | Exceptional 24.0% |
| Immigrants | Albania | 98.4 /100 | #108 | Exceptional 24.0% |
| Ugandans | 98.3 /100 | #109 | Exceptional 24.1% |
| Immigrants | Morocco | 98.1 /100 | #110 | Exceptional 24.1% |
| Soviet Union | 97.6 /100 | #111 | Exceptional 24.2% |
| Immigrants | Colombia | 97.0 /100 | #112 | Exceptional 24.3% |
| Sioux | 96.9 /100 | #113 | Exceptional 24.3% |
| Panamanians | 96.5 /100 | #114 | Exceptional 24.4% |
| Immigrants | Kenya | 96.4 /100 | #115 | Exceptional 24.4% |
| Alaska Natives | 96.0 /100 | #116 | Exceptional 24.4% |
| Immigrants | Afghanistan | 95.9 /100 | #117 | Exceptional 24.4% |
| Immigrants | Micronesia | 95.8 /100 | #118 | Exceptional 24.4% |
| Kenyans | 95.8 /100 | #119 | Exceptional 24.5% |