Lumbee vs Immigrants from Cambodia Wage/Income Gap
COMPARE
Lumbee
Immigrants from Cambodia
Wage/Income Gap
Wage/Income Gap Comparison
Lumbee
Immigrants from Cambodia
21.3%
WAGE/INCOME GAP
100.0/ 100
METRIC RATING
40th/ 347
METRIC RANK
23.3%
WAGE/INCOME GAP
99.7/ 100
METRIC RATING
85th/ 347
METRIC RANK
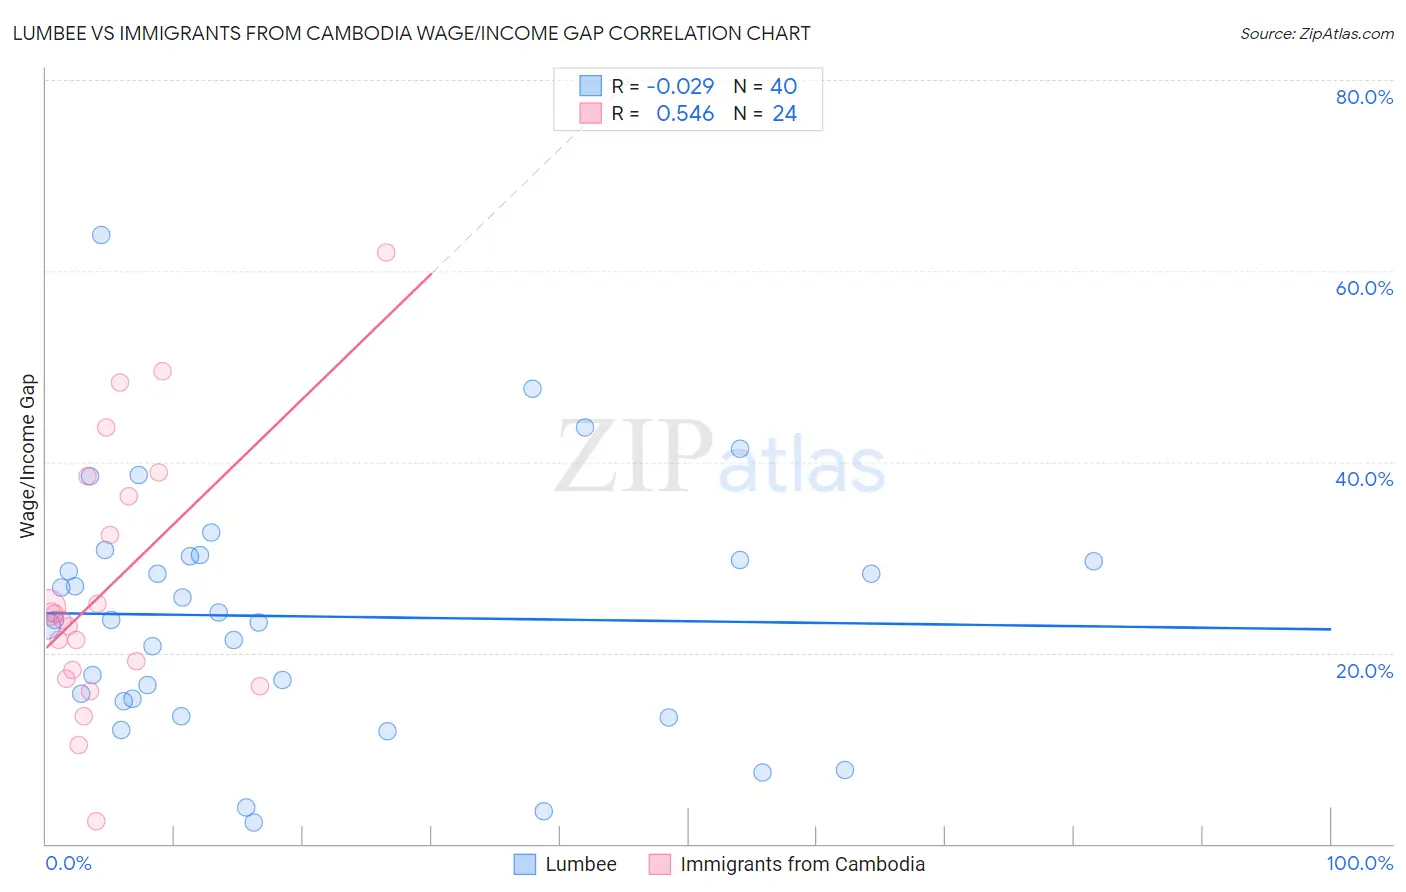
Lumbee vs Immigrants from Cambodia Wage/Income Gap Correlation Chart
The statistical analysis conducted on geographies consisting of 92,243,625 people shows no correlation between the proportion of Lumbee and wage/income gap percentage in the United States with a correlation coefficient (R) of -0.029 and weighted average of 21.3%. Similarly, the statistical analysis conducted on geographies consisting of 205,133,865 people shows a substantial positive correlation between the proportion of Immigrants from Cambodia and wage/income gap percentage in the United States with a correlation coefficient (R) of 0.546 and weighted average of 23.3%, a difference of 9.1%.
Wage/Income Gap Correlation Summary
| Measurement | Lumbee | Immigrants from Cambodia |
| Minimum | 2.2% | 2.3% |
| Maximum | 63.8% | 61.9% |
| Range | 61.6% | 59.6% |
| Mean | 23.8% | 27.1% |
| Median | 23.4% | 23.8% |
| Interquartile 25% (IQ1) | 15.1% | 17.8% |
| Interquartile 75% (IQ3) | 29.9% | 37.4% |
| Interquartile Range (IQR) | 14.8% | 19.7% |
| Standard Deviation (Sample) | 12.8% | 14.0% |
| Standard Deviation (Population) | 12.6% | 13.7% |
Similar Demographics by Wage/Income Gap
Demographics Similar to Lumbee by Wage/Income Gap
In terms of wage/income gap, the demographic groups most similar to Lumbee are Colville (21.3%, a difference of 0.20%), Immigrants from Belize (21.3%, a difference of 0.31%), Immigrants from Somalia (21.2%, a difference of 0.36%), Belizean (21.2%, a difference of 0.43%), and Somali (21.2%, a difference of 0.45%).
| Demographics | Rating | Rank | Wage/Income Gap |
| Immigrants | Bahamas | 100.0 /100 | #33 | Exceptional 21.1% |
| Pima | 100.0 /100 | #34 | Exceptional 21.1% |
| Somalis | 100.0 /100 | #35 | Exceptional 21.2% |
| Belizeans | 100.0 /100 | #36 | Exceptional 21.2% |
| Immigrants | Somalia | 100.0 /100 | #37 | Exceptional 21.2% |
| Immigrants | Belize | 100.0 /100 | #38 | Exceptional 21.3% |
| Colville | 100.0 /100 | #39 | Exceptional 21.3% |
| Lumbee | 100.0 /100 | #40 | Exceptional 21.3% |
| Liberians | 100.0 /100 | #41 | Exceptional 21.4% |
| Immigrants | Sierra Leone | 100.0 /100 | #42 | Exceptional 21.4% |
| Sierra Leoneans | 100.0 /100 | #43 | Exceptional 21.4% |
| Immigrants | Eritrea | 100.0 /100 | #44 | Exceptional 21.4% |
| U.S. Virgin Islanders | 100.0 /100 | #45 | Exceptional 21.5% |
| Immigrants | Ethiopia | 100.0 /100 | #46 | Exceptional 21.6% |
| Immigrants | Congo | 100.0 /100 | #47 | Exceptional 21.7% |
Demographics Similar to Immigrants from Cambodia by Wage/Income Gap
In terms of wage/income gap, the demographic groups most similar to Immigrants from Cambodia are Cuban (23.3%, a difference of 0.050%), Cheyenne (23.3%, a difference of 0.20%), Yuman (23.3%, a difference of 0.25%), Immigrants from Africa (23.2%, a difference of 0.43%), and Immigrants from Panama (23.4%, a difference of 0.57%).
| Demographics | Rating | Rank | Wage/Income Gap |
| Nigerians | 99.9 /100 | #78 | Exceptional 23.0% |
| Immigrants | Nicaragua | 99.9 /100 | #79 | Exceptional 23.0% |
| Salvadorans | 99.9 /100 | #80 | Exceptional 23.0% |
| Bermudans | 99.8 /100 | #81 | Exceptional 23.1% |
| Central Americans | 99.8 /100 | #82 | Exceptional 23.1% |
| Immigrants | Africa | 99.8 /100 | #83 | Exceptional 23.2% |
| Cubans | 99.7 /100 | #84 | Exceptional 23.3% |
| Immigrants | Cambodia | 99.7 /100 | #85 | Exceptional 23.3% |
| Cheyenne | 99.7 /100 | #86 | Exceptional 23.3% |
| Yuman | 99.7 /100 | #87 | Exceptional 23.3% |
| Immigrants | Panama | 99.6 /100 | #88 | Exceptional 23.4% |
| Marshallese | 99.6 /100 | #89 | Exceptional 23.4% |
| Nicaraguans | 99.6 /100 | #90 | Exceptional 23.4% |
| Arapaho | 99.6 /100 | #91 | Exceptional 23.5% |
| Immigrants | Honduras | 99.5 /100 | #92 | Exceptional 23.5% |