Immigrants from Hungary vs Immigrants from Cambodia Wage/Income Gap
COMPARE
Immigrants from Hungary
Immigrants from Cambodia
Wage/Income Gap
Wage/Income Gap Comparison
Immigrants from Hungary
Immigrants from Cambodia
27.0%
WAGE/INCOME GAP
4.8/ 100
METRIC RATING
235th/ 347
METRIC RANK
23.3%
WAGE/INCOME GAP
99.7/ 100
METRIC RATING
85th/ 347
METRIC RANK
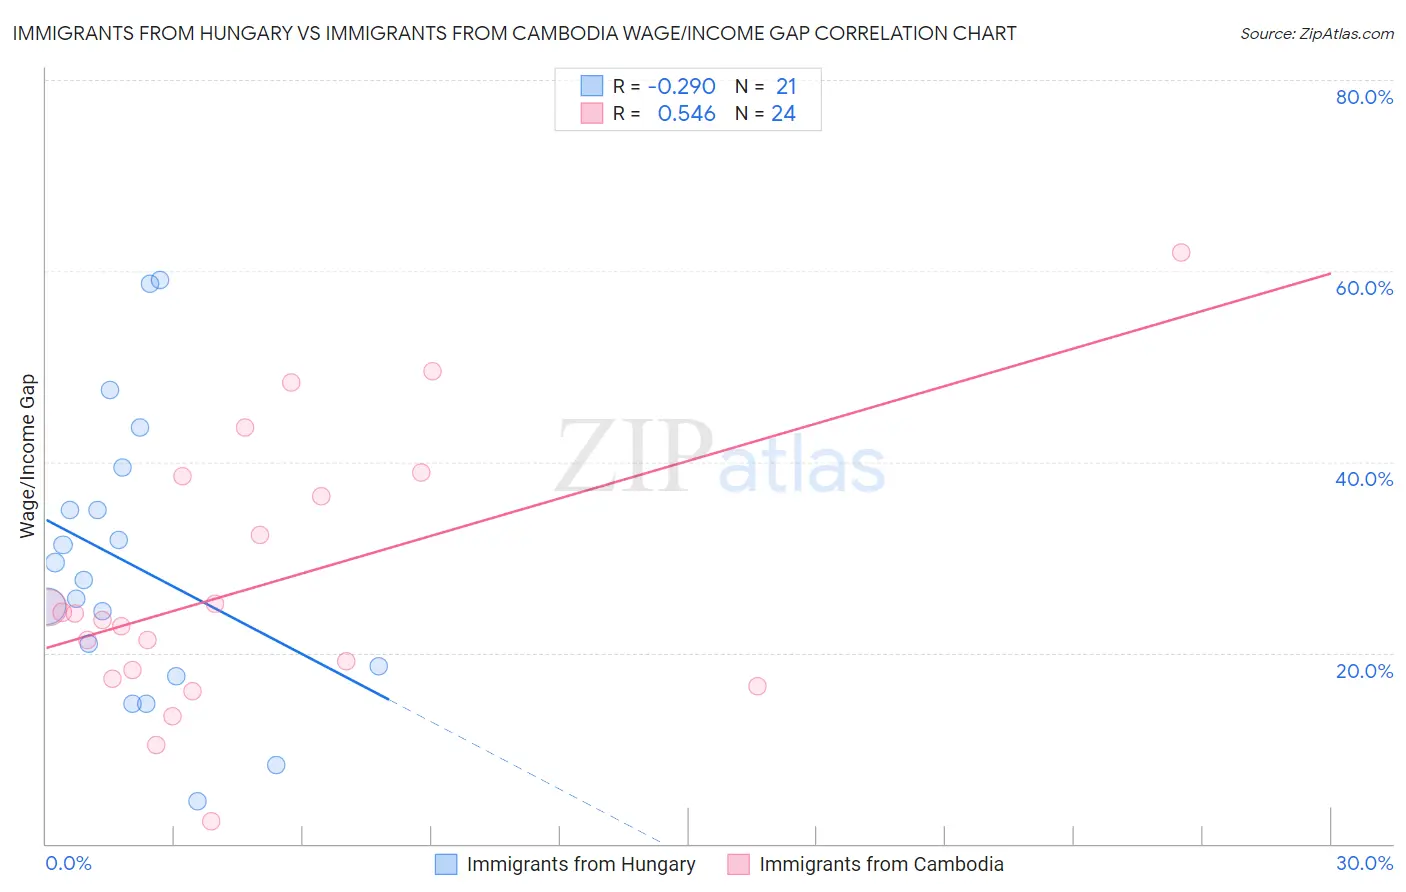
Immigrants from Hungary vs Immigrants from Cambodia Wage/Income Gap Correlation Chart
The statistical analysis conducted on geographies consisting of 195,626,970 people shows a weak negative correlation between the proportion of Immigrants from Hungary and wage/income gap percentage in the United States with a correlation coefficient (R) of -0.290 and weighted average of 27.0%. Similarly, the statistical analysis conducted on geographies consisting of 205,133,865 people shows a substantial positive correlation between the proportion of Immigrants from Cambodia and wage/income gap percentage in the United States with a correlation coefficient (R) of 0.546 and weighted average of 23.3%, a difference of 16.1%.
Wage/Income Gap Correlation Summary
| Measurement | Immigrants from Hungary | Immigrants from Cambodia |
| Minimum | 4.4% | 2.3% |
| Maximum | 59.1% | 61.9% |
| Range | 54.6% | 59.6% |
| Mean | 29.2% | 27.1% |
| Median | 27.6% | 23.8% |
| Interquartile 25% (IQ1) | 18.1% | 17.8% |
| Interquartile 75% (IQ3) | 37.2% | 37.4% |
| Interquartile Range (IQR) | 19.1% | 19.7% |
| Standard Deviation (Sample) | 14.7% | 14.0% |
| Standard Deviation (Population) | 14.4% | 13.7% |
Similar Demographics by Wage/Income Gap
Demographics Similar to Immigrants from Hungary by Wage/Income Gap
In terms of wage/income gap, the demographic groups most similar to Immigrants from Hungary are Immigrants from Pakistan (27.0%, a difference of 0.010%), Immigrants from Romania (27.0%, a difference of 0.020%), Immigrants from Brazil (27.0%, a difference of 0.060%), Argentinean (27.0%, a difference of 0.12%), and Bhutanese (27.0%, a difference of 0.15%).
| Demographics | Rating | Rank | Wage/Income Gap |
| Immigrants | Turkey | 5.6 /100 | #228 | Tragic 27.0% |
| Immigrants | Asia | 5.5 /100 | #229 | Tragic 27.0% |
| Ottawa | 5.3 /100 | #230 | Tragic 27.0% |
| Bhutanese | 5.3 /100 | #231 | Tragic 27.0% |
| Argentineans | 5.2 /100 | #232 | Tragic 27.0% |
| Immigrants | Brazil | 5.0 /100 | #233 | Tragic 27.0% |
| Immigrants | Pakistan | 4.9 /100 | #234 | Tragic 27.0% |
| Immigrants | Hungary | 4.8 /100 | #235 | Tragic 27.0% |
| Immigrants | Romania | 4.8 /100 | #236 | Tragic 27.0% |
| Immigrants | Eastern Asia | 4.4 /100 | #237 | Tragic 27.1% |
| Osage | 4.4 /100 | #238 | Tragic 27.1% |
| Estonians | 4.3 /100 | #239 | Tragic 27.1% |
| Immigrants | Europe | 3.8 /100 | #240 | Tragic 27.1% |
| Creek | 3.8 /100 | #241 | Tragic 27.1% |
| Immigrants | Sri Lanka | 3.7 /100 | #242 | Tragic 27.1% |
Demographics Similar to Immigrants from Cambodia by Wage/Income Gap
In terms of wage/income gap, the demographic groups most similar to Immigrants from Cambodia are Cuban (23.3%, a difference of 0.050%), Cheyenne (23.3%, a difference of 0.20%), Yuman (23.3%, a difference of 0.25%), Immigrants from Africa (23.2%, a difference of 0.43%), and Immigrants from Panama (23.4%, a difference of 0.57%).
| Demographics | Rating | Rank | Wage/Income Gap |
| Nigerians | 99.9 /100 | #78 | Exceptional 23.0% |
| Immigrants | Nicaragua | 99.9 /100 | #79 | Exceptional 23.0% |
| Salvadorans | 99.9 /100 | #80 | Exceptional 23.0% |
| Bermudans | 99.8 /100 | #81 | Exceptional 23.1% |
| Central Americans | 99.8 /100 | #82 | Exceptional 23.1% |
| Immigrants | Africa | 99.8 /100 | #83 | Exceptional 23.2% |
| Cubans | 99.7 /100 | #84 | Exceptional 23.3% |
| Immigrants | Cambodia | 99.7 /100 | #85 | Exceptional 23.3% |
| Cheyenne | 99.7 /100 | #86 | Exceptional 23.3% |
| Yuman | 99.7 /100 | #87 | Exceptional 23.3% |
| Immigrants | Panama | 99.6 /100 | #88 | Exceptional 23.4% |
| Marshallese | 99.6 /100 | #89 | Exceptional 23.4% |
| Nicaraguans | 99.6 /100 | #90 | Exceptional 23.4% |
| Arapaho | 99.6 /100 | #91 | Exceptional 23.5% |
| Immigrants | Honduras | 99.5 /100 | #92 | Exceptional 23.5% |