Immigrants from Norway vs Immigrants from Cambodia Wage/Income Gap
COMPARE
Immigrants from Norway
Immigrants from Cambodia
Wage/Income Gap
Wage/Income Gap Comparison
Immigrants from Norway
Immigrants from Cambodia
27.3%
WAGE/INCOME GAP
2.5/ 100
METRIC RATING
251st/ 347
METRIC RANK
23.3%
WAGE/INCOME GAP
99.7/ 100
METRIC RATING
85th/ 347
METRIC RANK
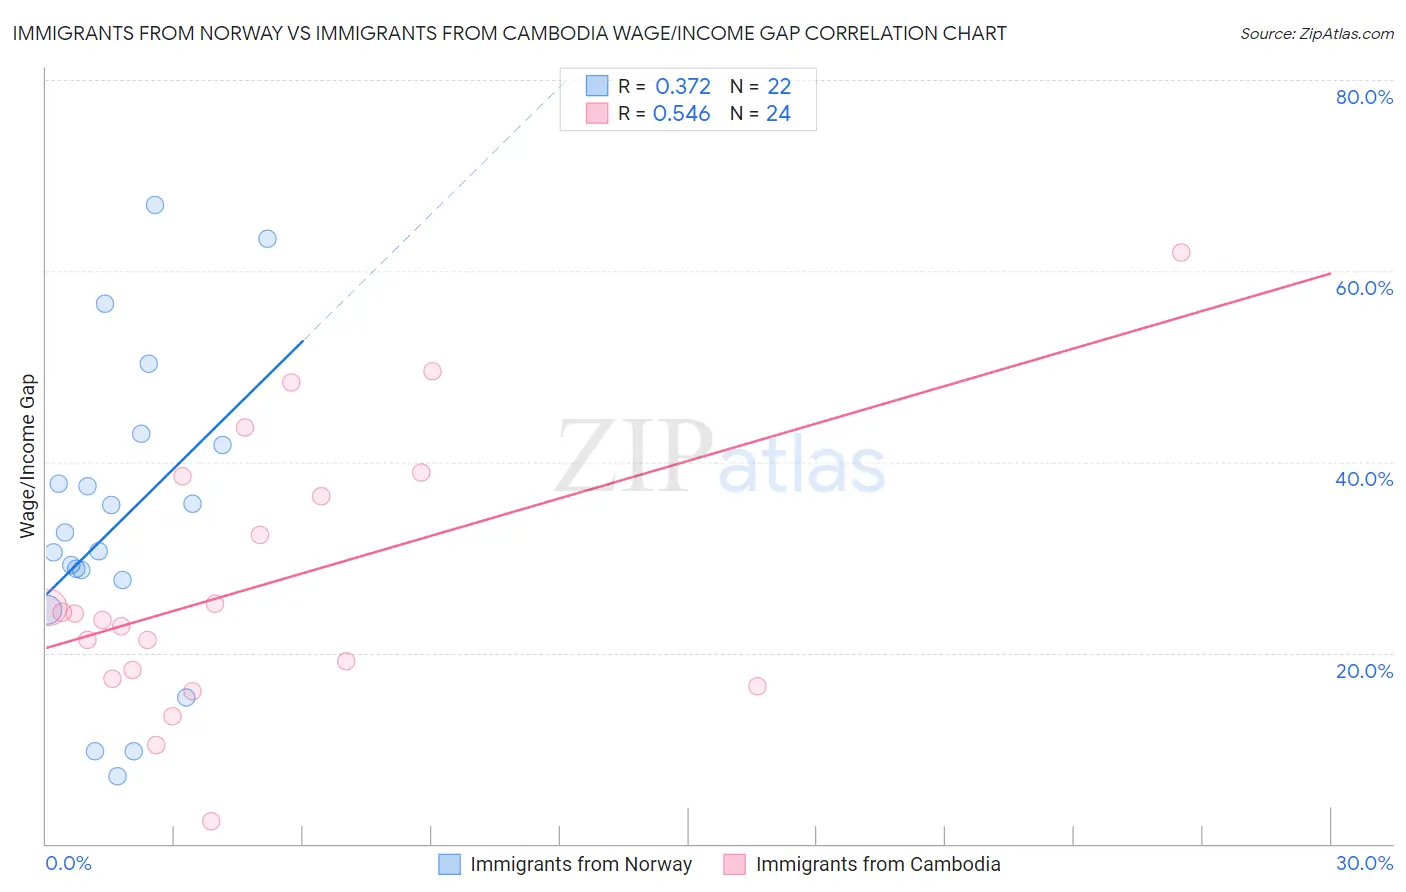
Immigrants from Norway vs Immigrants from Cambodia Wage/Income Gap Correlation Chart
The statistical analysis conducted on geographies consisting of 116,688,062 people shows a mild positive correlation between the proportion of Immigrants from Norway and wage/income gap percentage in the United States with a correlation coefficient (R) of 0.372 and weighted average of 27.3%. Similarly, the statistical analysis conducted on geographies consisting of 205,133,865 people shows a substantial positive correlation between the proportion of Immigrants from Cambodia and wage/income gap percentage in the United States with a correlation coefficient (R) of 0.546 and weighted average of 23.3%, a difference of 17.3%.
Wage/Income Gap Correlation Summary
| Measurement | Immigrants from Norway | Immigrants from Cambodia |
| Minimum | 7.1% | 2.3% |
| Maximum | 66.9% | 61.9% |
| Range | 59.8% | 59.6% |
| Mean | 33.7% | 27.1% |
| Median | 31.6% | 23.8% |
| Interquartile 25% (IQ1) | 27.6% | 17.8% |
| Interquartile 75% (IQ3) | 41.8% | 37.4% |
| Interquartile Range (IQR) | 14.2% | 19.7% |
| Standard Deviation (Sample) | 16.0% | 14.0% |
| Standard Deviation (Population) | 15.6% | 13.7% |
Similar Demographics by Wage/Income Gap
Demographics Similar to Immigrants from Norway by Wage/Income Gap
In terms of wage/income gap, the demographic groups most similar to Immigrants from Norway are Ukrainian (27.3%, a difference of 0.060%), Immigrants from Czechoslovakia (27.3%, a difference of 0.10%), Carpatho Rusyn (27.3%, a difference of 0.12%), Cypriot (27.3%, a difference of 0.13%), and Celtic (27.3%, a difference of 0.14%).
| Demographics | Rating | Rank | Wage/Income Gap |
| Chickasaw | 3.5 /100 | #244 | Tragic 27.2% |
| Immigrants | Azores | 3.5 /100 | #245 | Tragic 27.2% |
| Immigrants | Nonimmigrants | 3.3 /100 | #246 | Tragic 27.2% |
| Celtics | 2.8 /100 | #247 | Tragic 27.3% |
| Cypriots | 2.8 /100 | #248 | Tragic 27.3% |
| Carpatho Rusyns | 2.7 /100 | #249 | Tragic 27.3% |
| Immigrants | Czechoslovakia | 2.7 /100 | #250 | Tragic 27.3% |
| Immigrants | Norway | 2.5 /100 | #251 | Tragic 27.3% |
| Ukrainians | 2.4 /100 | #252 | Tragic 27.3% |
| Portuguese | 2.2 /100 | #253 | Tragic 27.4% |
| Israelis | 2.1 /100 | #254 | Tragic 27.4% |
| Immigrants | France | 2.1 /100 | #255 | Tragic 27.4% |
| Cherokee | 1.9 /100 | #256 | Tragic 27.4% |
| Luxembourgers | 1.9 /100 | #257 | Tragic 27.4% |
| Slavs | 1.8 /100 | #258 | Tragic 27.4% |
Demographics Similar to Immigrants from Cambodia by Wage/Income Gap
In terms of wage/income gap, the demographic groups most similar to Immigrants from Cambodia are Cuban (23.3%, a difference of 0.050%), Cheyenne (23.3%, a difference of 0.20%), Yuman (23.3%, a difference of 0.25%), Immigrants from Africa (23.2%, a difference of 0.43%), and Immigrants from Panama (23.4%, a difference of 0.57%).
| Demographics | Rating | Rank | Wage/Income Gap |
| Nigerians | 99.9 /100 | #78 | Exceptional 23.0% |
| Immigrants | Nicaragua | 99.9 /100 | #79 | Exceptional 23.0% |
| Salvadorans | 99.9 /100 | #80 | Exceptional 23.0% |
| Bermudans | 99.8 /100 | #81 | Exceptional 23.1% |
| Central Americans | 99.8 /100 | #82 | Exceptional 23.1% |
| Immigrants | Africa | 99.8 /100 | #83 | Exceptional 23.2% |
| Cubans | 99.7 /100 | #84 | Exceptional 23.3% |
| Immigrants | Cambodia | 99.7 /100 | #85 | Exceptional 23.3% |
| Cheyenne | 99.7 /100 | #86 | Exceptional 23.3% |
| Yuman | 99.7 /100 | #87 | Exceptional 23.3% |
| Immigrants | Panama | 99.6 /100 | #88 | Exceptional 23.4% |
| Marshallese | 99.6 /100 | #89 | Exceptional 23.4% |
| Nicaraguans | 99.6 /100 | #90 | Exceptional 23.4% |
| Arapaho | 99.6 /100 | #91 | Exceptional 23.5% |
| Immigrants | Honduras | 99.5 /100 | #92 | Exceptional 23.5% |