Lumbee vs Immigrants from Saudi Arabia Wage/Income Gap
COMPARE
Lumbee
Immigrants from Saudi Arabia
Wage/Income Gap
Wage/Income Gap Comparison
Lumbee
Immigrants from Saudi Arabia
21.3%
WAGE/INCOME GAP
100.0/ 100
METRIC RATING
40th/ 347
METRIC RANK
26.7%
WAGE/INCOME GAP
9.1/ 100
METRIC RATING
218th/ 347
METRIC RANK
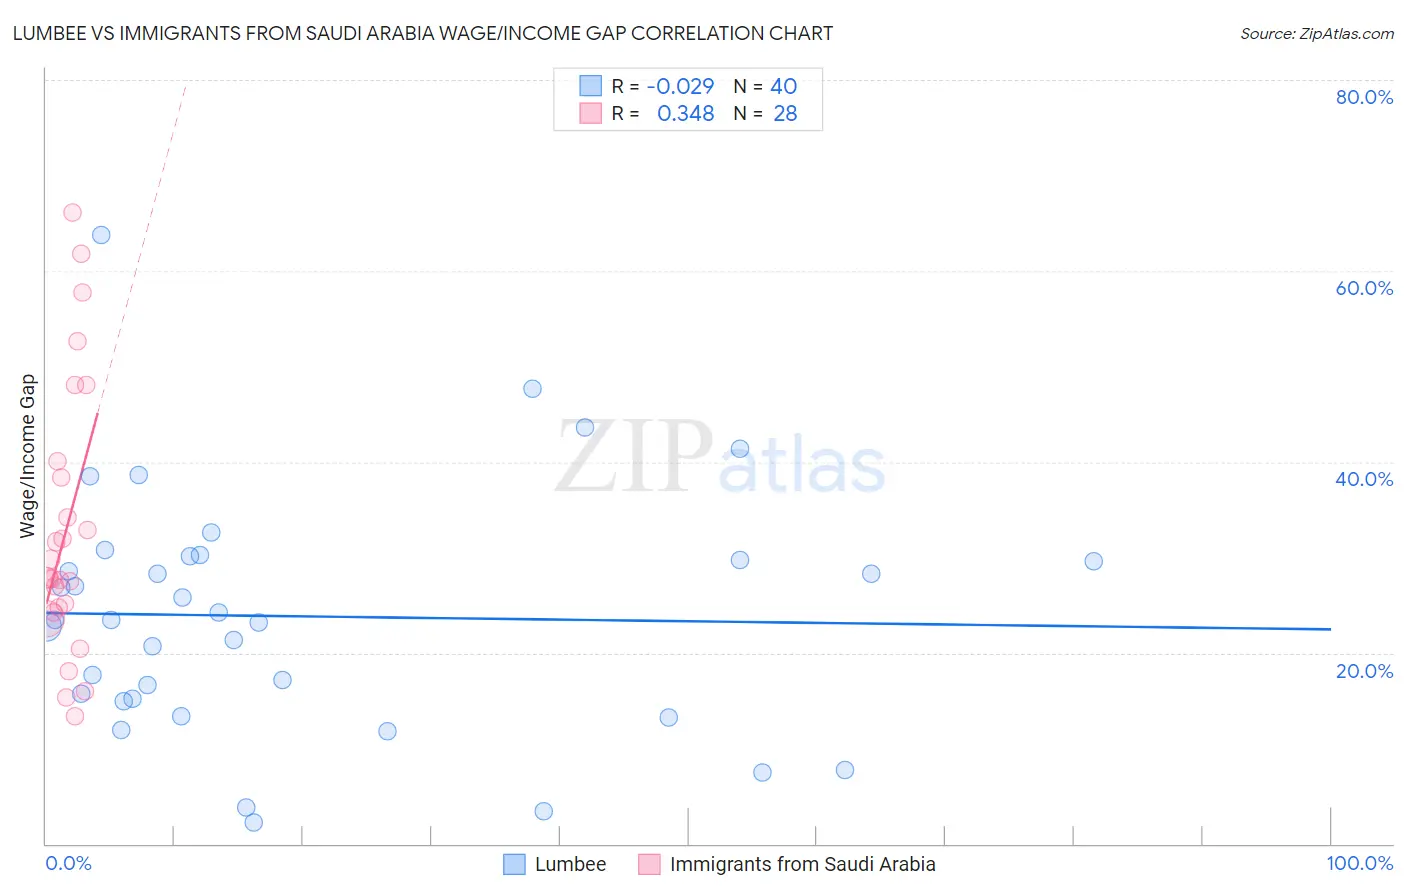
Lumbee vs Immigrants from Saudi Arabia Wage/Income Gap Correlation Chart
The statistical analysis conducted on geographies consisting of 92,243,625 people shows no correlation between the proportion of Lumbee and wage/income gap percentage in the United States with a correlation coefficient (R) of -0.029 and weighted average of 21.3%. Similarly, the statistical analysis conducted on geographies consisting of 164,286,735 people shows a mild positive correlation between the proportion of Immigrants from Saudi Arabia and wage/income gap percentage in the United States with a correlation coefficient (R) of 0.348 and weighted average of 26.7%, a difference of 25.4%.
Wage/Income Gap Correlation Summary
| Measurement | Lumbee | Immigrants from Saudi Arabia |
| Minimum | 2.2% | 13.4% |
| Maximum | 63.8% | 66.1% |
| Range | 61.6% | 52.7% |
| Mean | 23.8% | 32.8% |
| Median | 23.4% | 27.8% |
| Interquartile 25% (IQ1) | 15.1% | 24.5% |
| Interquartile 75% (IQ3) | 29.9% | 39.2% |
| Interquartile Range (IQR) | 14.8% | 14.8% |
| Standard Deviation (Sample) | 12.8% | 14.0% |
| Standard Deviation (Population) | 12.6% | 13.8% |
Similar Demographics by Wage/Income Gap
Demographics Similar to Lumbee by Wage/Income Gap
In terms of wage/income gap, the demographic groups most similar to Lumbee are Colville (21.3%, a difference of 0.20%), Immigrants from Belize (21.3%, a difference of 0.31%), Immigrants from Somalia (21.2%, a difference of 0.36%), Belizean (21.2%, a difference of 0.43%), and Somali (21.2%, a difference of 0.45%).
| Demographics | Rating | Rank | Wage/Income Gap |
| Immigrants | Bahamas | 100.0 /100 | #33 | Exceptional 21.1% |
| Pima | 100.0 /100 | #34 | Exceptional 21.1% |
| Somalis | 100.0 /100 | #35 | Exceptional 21.2% |
| Belizeans | 100.0 /100 | #36 | Exceptional 21.2% |
| Immigrants | Somalia | 100.0 /100 | #37 | Exceptional 21.2% |
| Immigrants | Belize | 100.0 /100 | #38 | Exceptional 21.3% |
| Colville | 100.0 /100 | #39 | Exceptional 21.3% |
| Lumbee | 100.0 /100 | #40 | Exceptional 21.3% |
| Liberians | 100.0 /100 | #41 | Exceptional 21.4% |
| Immigrants | Sierra Leone | 100.0 /100 | #42 | Exceptional 21.4% |
| Sierra Leoneans | 100.0 /100 | #43 | Exceptional 21.4% |
| Immigrants | Eritrea | 100.0 /100 | #44 | Exceptional 21.4% |
| U.S. Virgin Islanders | 100.0 /100 | #45 | Exceptional 21.5% |
| Immigrants | Ethiopia | 100.0 /100 | #46 | Exceptional 21.6% |
| Immigrants | Congo | 100.0 /100 | #47 | Exceptional 21.7% |
Demographics Similar to Immigrants from Saudi Arabia by Wage/Income Gap
In terms of wage/income gap, the demographic groups most similar to Immigrants from Saudi Arabia are Brazilian (26.7%, a difference of 0.030%), Immigrants from Poland (26.7%, a difference of 0.030%), Immigrants from Latvia (26.7%, a difference of 0.040%), Immigrants from Portugal (26.7%, a difference of 0.080%), and Immigrants from Spain (26.8%, a difference of 0.11%).
| Demographics | Rating | Rank | Wage/Income Gap |
| Mongolians | 11.4 /100 | #211 | Poor 26.6% |
| Iraqis | 11.2 /100 | #212 | Poor 26.6% |
| Immigrants | Iraq | 10.3 /100 | #213 | Poor 26.7% |
| Immigrants | China | 10.3 /100 | #214 | Poor 26.7% |
| Yugoslavians | 9.7 /100 | #215 | Tragic 26.7% |
| Immigrants | Portugal | 9.5 /100 | #216 | Tragic 26.7% |
| Brazilians | 9.2 /100 | #217 | Tragic 26.7% |
| Immigrants | Saudi Arabia | 9.1 /100 | #218 | Tragic 26.7% |
| Immigrants | Poland | 8.9 /100 | #219 | Tragic 26.7% |
| Immigrants | Latvia | 8.9 /100 | #220 | Tragic 26.7% |
| Immigrants | Spain | 8.5 /100 | #221 | Tragic 26.8% |
| Bolivians | 8.3 /100 | #222 | Tragic 26.8% |
| Jordanians | 8.0 /100 | #223 | Tragic 26.8% |
| Immigrants | Argentina | 7.2 /100 | #224 | Tragic 26.8% |
| Immigrants | Ireland | 6.5 /100 | #225 | Tragic 26.9% |