Lumbee vs Sri Lankan Wage/Income Gap
COMPARE
Lumbee
Sri Lankan
Wage/Income Gap
Wage/Income Gap Comparison
Lumbee
Sri Lankans
21.3%
WAGE/INCOME GAP
100.0/ 100
METRIC RATING
40th/ 347
METRIC RANK
25.8%
WAGE/INCOME GAP
47.0/ 100
METRIC RATING
175th/ 347
METRIC RANK
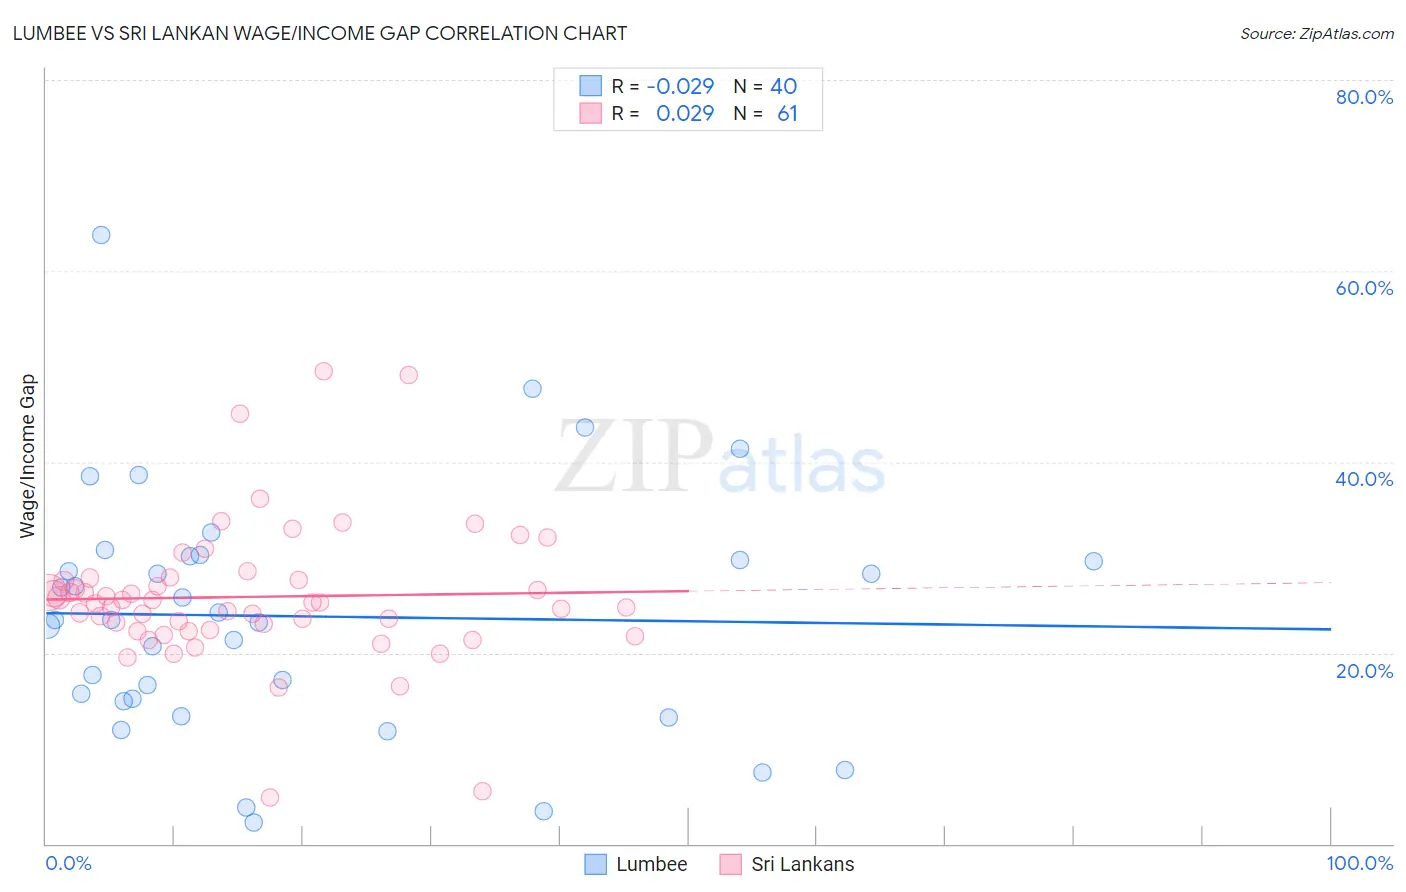
Lumbee vs Sri Lankan Wage/Income Gap Correlation Chart
The statistical analysis conducted on geographies consisting of 92,243,625 people shows no correlation between the proportion of Lumbee and wage/income gap percentage in the United States with a correlation coefficient (R) of -0.029 and weighted average of 21.3%. Similarly, the statistical analysis conducted on geographies consisting of 440,345,816 people shows no correlation between the proportion of Sri Lankans and wage/income gap percentage in the United States with a correlation coefficient (R) of 0.029 and weighted average of 25.8%, a difference of 21.1%.
Wage/Income Gap Correlation Summary
| Measurement | Lumbee | Sri Lankan |
| Minimum | 2.2% | 4.9% |
| Maximum | 63.8% | 49.5% |
| Range | 61.6% | 44.7% |
| Mean | 23.8% | 25.9% |
| Median | 23.4% | 25.2% |
| Interquartile 25% (IQ1) | 15.1% | 22.3% |
| Interquartile 75% (IQ3) | 29.9% | 27.8% |
| Interquartile Range (IQR) | 14.8% | 5.4% |
| Standard Deviation (Sample) | 12.8% | 7.4% |
| Standard Deviation (Population) | 12.6% | 7.4% |
Similar Demographics by Wage/Income Gap
Demographics Similar to Lumbee by Wage/Income Gap
In terms of wage/income gap, the demographic groups most similar to Lumbee are Colville (21.3%, a difference of 0.20%), Immigrants from Belize (21.3%, a difference of 0.31%), Immigrants from Somalia (21.2%, a difference of 0.36%), Belizean (21.2%, a difference of 0.43%), and Somali (21.2%, a difference of 0.45%).
| Demographics | Rating | Rank | Wage/Income Gap |
| Immigrants | Bahamas | 100.0 /100 | #33 | Exceptional 21.1% |
| Pima | 100.0 /100 | #34 | Exceptional 21.1% |
| Somalis | 100.0 /100 | #35 | Exceptional 21.2% |
| Belizeans | 100.0 /100 | #36 | Exceptional 21.2% |
| Immigrants | Somalia | 100.0 /100 | #37 | Exceptional 21.2% |
| Immigrants | Belize | 100.0 /100 | #38 | Exceptional 21.3% |
| Colville | 100.0 /100 | #39 | Exceptional 21.3% |
| Lumbee | 100.0 /100 | #40 | Exceptional 21.3% |
| Liberians | 100.0 /100 | #41 | Exceptional 21.4% |
| Immigrants | Sierra Leone | 100.0 /100 | #42 | Exceptional 21.4% |
| Sierra Leoneans | 100.0 /100 | #43 | Exceptional 21.4% |
| Immigrants | Eritrea | 100.0 /100 | #44 | Exceptional 21.4% |
| U.S. Virgin Islanders | 100.0 /100 | #45 | Exceptional 21.5% |
| Immigrants | Ethiopia | 100.0 /100 | #46 | Exceptional 21.6% |
| Immigrants | Congo | 100.0 /100 | #47 | Exceptional 21.7% |
Demographics Similar to Sri Lankans by Wage/Income Gap
In terms of wage/income gap, the demographic groups most similar to Sri Lankans are Paraguayan (25.8%, a difference of 0.020%), Cambodian (25.8%, a difference of 0.12%), Alaskan Athabascan (25.8%, a difference of 0.20%), Chinese (25.9%, a difference of 0.33%), and Immigrants from Belarus (25.7%, a difference of 0.39%).
| Demographics | Rating | Rank | Wage/Income Gap |
| Seminole | 62.6 /100 | #168 | Good 25.6% |
| Peruvians | 60.1 /100 | #169 | Good 25.6% |
| Immigrants | Oceania | 57.5 /100 | #170 | Average 25.6% |
| Immigrants | Greece | 56.6 /100 | #171 | Average 25.7% |
| Immigrants | Chile | 53.2 /100 | #172 | Average 25.7% |
| Immigrants | Belarus | 52.9 /100 | #173 | Average 25.7% |
| Alaskan Athabascans | 50.0 /100 | #174 | Average 25.8% |
| Sri Lankans | 47.0 /100 | #175 | Average 25.8% |
| Paraguayans | 46.7 /100 | #176 | Average 25.8% |
| Cambodians | 45.1 /100 | #177 | Average 25.8% |
| Chinese | 42.0 /100 | #178 | Average 25.9% |
| Samoans | 38.6 /100 | #179 | Fair 26.0% |
| Guamanians/Chamorros | 38.0 /100 | #180 | Fair 26.0% |
| Immigrants | Bolivia | 36.4 /100 | #181 | Fair 26.0% |
| Immigrants | Serbia | 35.4 /100 | #182 | Fair 26.0% |