Iroquois vs South American Currently Married
COMPARE
Iroquois
South American
Currently Married
Currently Married Comparison
Iroquois
South Americans
44.7%
CURRENTLY MARRIED
1.1/ 100
METRIC RATING
234th/ 347
METRIC RANK
46.1%
CURRENTLY MARRIED
23.8/ 100
METRIC RATING
194th/ 347
METRIC RANK
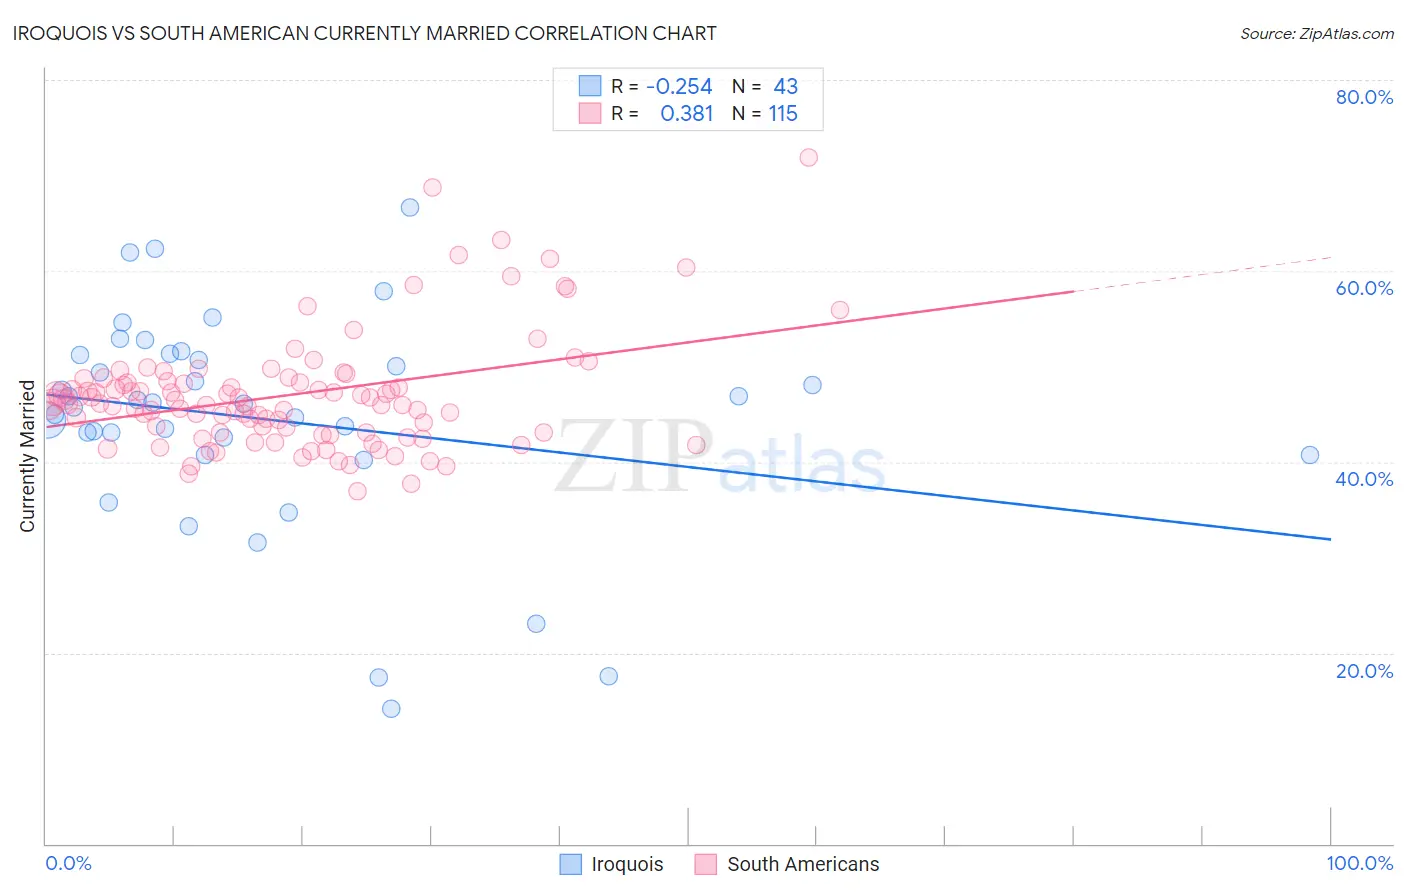
Iroquois vs South American Currently Married Correlation Chart
The statistical analysis conducted on geographies consisting of 207,297,556 people shows a weak negative correlation between the proportion of Iroquois and percentage of population currently married in the United States with a correlation coefficient (R) of -0.254 and weighted average of 44.7%. Similarly, the statistical analysis conducted on geographies consisting of 494,081,354 people shows a mild positive correlation between the proportion of South Americans and percentage of population currently married in the United States with a correlation coefficient (R) of 0.381 and weighted average of 46.1%, a difference of 3.2%.
Currently Married Correlation Summary
| Measurement | Iroquois | South American |
| Minimum | 14.1% | 37.0% |
| Maximum | 66.7% | 71.9% |
| Range | 52.6% | 34.9% |
| Mean | 44.5% | 47.0% |
| Median | 46.1% | 46.1% |
| Interquartile 25% (IQ1) | 40.7% | 43.1% |
| Interquartile 75% (IQ3) | 51.2% | 48.4% |
| Interquartile Range (IQR) | 10.5% | 5.3% |
| Standard Deviation (Sample) | 11.2% | 6.0% |
| Standard Deviation (Population) | 11.1% | 6.0% |
Similar Demographics by Currently Married
Demographics Similar to Iroquois by Currently Married
In terms of currently married, the demographic groups most similar to Iroquois are Immigrants from Saudi Arabia (44.7%, a difference of 0.010%), Nepalese (44.7%, a difference of 0.060%), Alaskan Athabascan (44.6%, a difference of 0.16%), Cuban (44.6%, a difference of 0.16%), and Seminole (44.6%, a difference of 0.17%).
| Demographics | Rating | Rank | Currently Married |
| Spanish Americans | 2.1 /100 | #227 | Tragic 45.0% |
| Immigrants | Uruguay | 2.0 /100 | #228 | Tragic 45.0% |
| Cree | 1.7 /100 | #229 | Tragic 44.9% |
| Immigrants | Kenya | 1.6 /100 | #230 | Tragic 44.9% |
| Immigrants | Panama | 1.5 /100 | #231 | Tragic 44.9% |
| Nepalese | 1.2 /100 | #232 | Tragic 44.7% |
| Immigrants | Saudi Arabia | 1.1 /100 | #233 | Tragic 44.7% |
| Iroquois | 1.1 /100 | #234 | Tragic 44.7% |
| Alaskan Athabascans | 0.9 /100 | #235 | Tragic 44.6% |
| Cubans | 0.9 /100 | #236 | Tragic 44.6% |
| Seminole | 0.9 /100 | #237 | Tragic 44.6% |
| Moroccans | 0.9 /100 | #238 | Tragic 44.6% |
| Immigrants | Mexico | 0.7 /100 | #239 | Tragic 44.5% |
| Mexican American Indians | 0.7 /100 | #240 | Tragic 44.5% |
| Ethiopians | 0.7 /100 | #241 | Tragic 44.5% |
Demographics Similar to South Americans by Currently Married
In terms of currently married, the demographic groups most similar to South Americans are Immigrants from Nepal (46.1%, a difference of 0.010%), Immigrants from Fiji (46.2%, a difference of 0.060%), Immigrants from Bosnia and Herzegovina (46.1%, a difference of 0.080%), Soviet Union (46.2%, a difference of 0.10%), and Immigrants from Kuwait (46.1%, a difference of 0.11%).
| Demographics | Rating | Rank | Currently Married |
| Immigrants | Peru | 35.3 /100 | #187 | Fair 46.4% |
| Colombians | 31.8 /100 | #188 | Fair 46.3% |
| Fijians | 30.3 /100 | #189 | Fair 46.3% |
| Choctaw | 29.1 /100 | #190 | Fair 46.3% |
| Immigrants | France | 27.7 /100 | #191 | Fair 46.2% |
| Soviet Union | 25.7 /100 | #192 | Fair 46.2% |
| Immigrants | Fiji | 25.0 /100 | #193 | Fair 46.2% |
| South Americans | 23.8 /100 | #194 | Fair 46.1% |
| Immigrants | Nepal | 23.7 /100 | #195 | Fair 46.1% |
| Immigrants | Bosnia and Herzegovina | 22.2 /100 | #196 | Fair 46.1% |
| Immigrants | Kuwait | 21.7 /100 | #197 | Fair 46.1% |
| Immigrants | Colombia | 21.0 /100 | #198 | Fair 46.1% |
| Immigrants | Costa Rica | 19.6 /100 | #199 | Poor 46.0% |
| Creek | 17.2 /100 | #200 | Poor 46.0% |
| Malaysians | 15.3 /100 | #201 | Poor 45.9% |