Immigrants from Argentina vs South American Wage/Income Gap
COMPARE
Immigrants from Argentina
South American
Wage/Income Gap
Wage/Income Gap Comparison
Immigrants from Argentina
South Americans
26.8%
WAGE/INCOME GAP
7.2/ 100
METRIC RATING
224th/ 347
METRIC RANK
25.0%
WAGE/INCOME GAP
85.2/ 100
METRIC RATING
146th/ 347
METRIC RANK
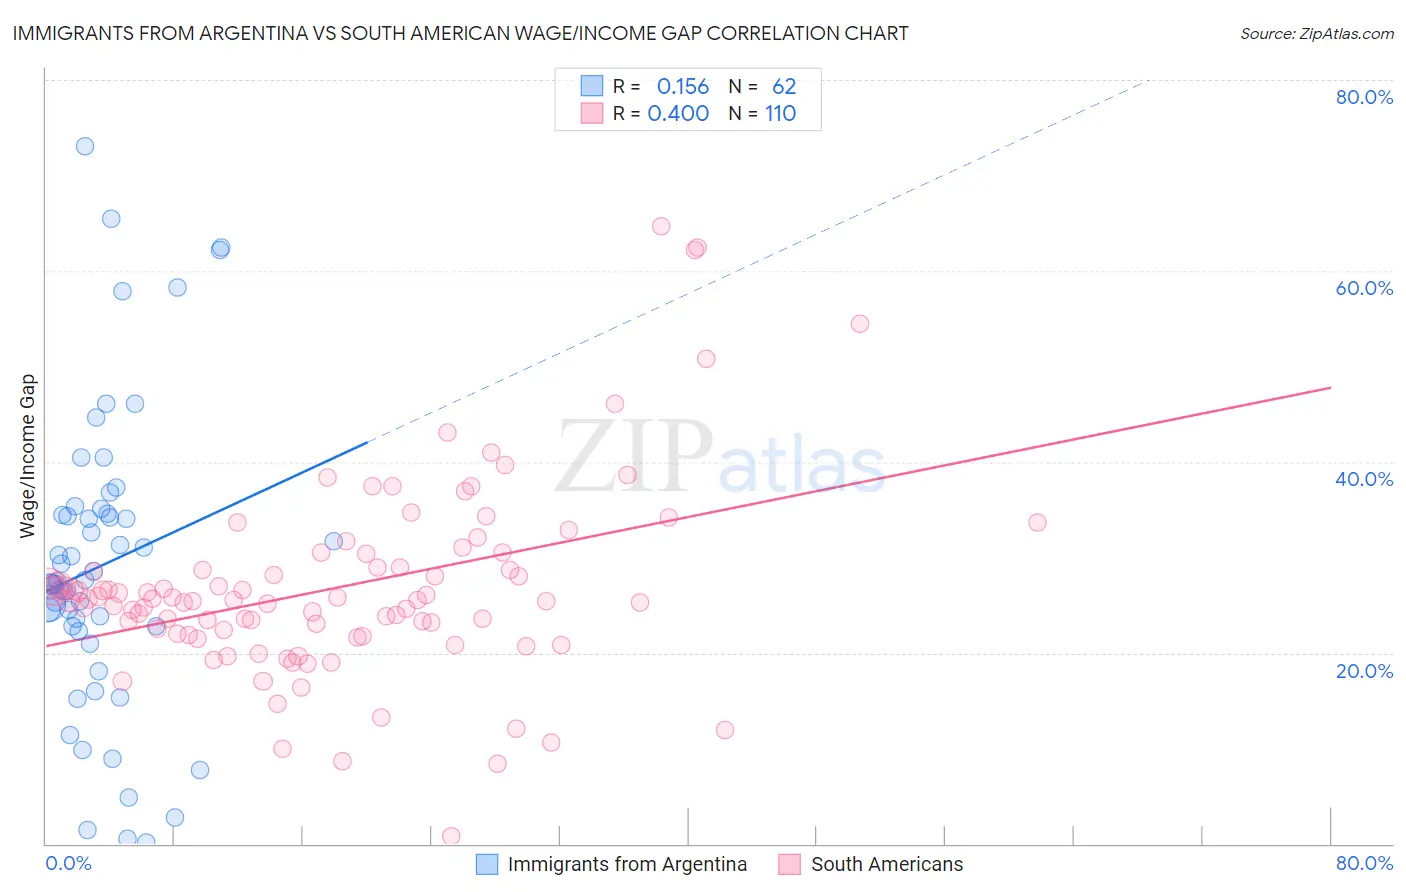
Immigrants from Argentina vs South American Wage/Income Gap Correlation Chart
The statistical analysis conducted on geographies consisting of 264,345,547 people shows a poor positive correlation between the proportion of Immigrants from Argentina and wage/income gap percentage in the United States with a correlation coefficient (R) of 0.156 and weighted average of 26.8%. Similarly, the statistical analysis conducted on geographies consisting of 493,539,614 people shows a mild positive correlation between the proportion of South Americans and wage/income gap percentage in the United States with a correlation coefficient (R) of 0.400 and weighted average of 25.0%, a difference of 7.2%.
Wage/Income Gap Correlation Summary
| Measurement | Immigrants from Argentina | South American |
| Minimum | 0.074% | 0.78% |
| Maximum | 73.0% | 64.7% |
| Range | 73.0% | 63.9% |
| Mean | 29.2% | 26.9% |
| Median | 27.4% | 25.5% |
| Interquartile 25% (IQ1) | 22.7% | 22.0% |
| Interquartile 75% (IQ3) | 34.6% | 29.0% |
| Interquartile Range (IQR) | 11.9% | 7.0% |
| Standard Deviation (Sample) | 15.6% | 10.2% |
| Standard Deviation (Population) | 15.5% | 10.1% |
Similar Demographics by Wage/Income Gap
Demographics Similar to Immigrants from Argentina by Wage/Income Gap
In terms of wage/income gap, the demographic groups most similar to Immigrants from Argentina are Jordanian (26.8%, a difference of 0.17%), Immigrants from Ireland (26.9%, a difference of 0.17%), Bolivian (26.8%, a difference of 0.25%), Immigrants from Spain (26.8%, a difference of 0.28%), and Asian (26.9%, a difference of 0.33%).
| Demographics | Rating | Rank | Wage/Income Gap |
| Brazilians | 9.2 /100 | #217 | Tragic 26.7% |
| Immigrants | Saudi Arabia | 9.1 /100 | #218 | Tragic 26.7% |
| Immigrants | Poland | 8.9 /100 | #219 | Tragic 26.7% |
| Immigrants | Latvia | 8.9 /100 | #220 | Tragic 26.7% |
| Immigrants | Spain | 8.5 /100 | #221 | Tragic 26.8% |
| Bolivians | 8.3 /100 | #222 | Tragic 26.8% |
| Jordanians | 8.0 /100 | #223 | Tragic 26.8% |
| Immigrants | Argentina | 7.2 /100 | #224 | Tragic 26.8% |
| Immigrants | Ireland | 6.5 /100 | #225 | Tragic 26.9% |
| Asians | 5.9 /100 | #226 | Tragic 26.9% |
| Spaniards | 5.6 /100 | #227 | Tragic 27.0% |
| Immigrants | Turkey | 5.6 /100 | #228 | Tragic 27.0% |
| Immigrants | Asia | 5.5 /100 | #229 | Tragic 27.0% |
| Ottawa | 5.3 /100 | #230 | Tragic 27.0% |
| Bhutanese | 5.3 /100 | #231 | Tragic 27.0% |
Demographics Similar to South Americans by Wage/Income Gap
In terms of wage/income gap, the demographic groups most similar to South Americans are Comanche (25.0%, a difference of 0.0%), Malaysian (25.0%, a difference of 0.030%), Iroquois (25.1%, a difference of 0.16%), Chippewa (25.0%, a difference of 0.24%), and Immigrants from Peru (25.1%, a difference of 0.31%).
| Demographics | Rating | Rank | Wage/Income Gap |
| Hispanics or Latinos | 89.5 /100 | #139 | Excellent 24.9% |
| Immigrants | Nepal | 89.3 /100 | #140 | Excellent 24.9% |
| Hawaiians | 89.3 /100 | #141 | Excellent 24.9% |
| Afghans | 88.1 /100 | #142 | Excellent 24.9% |
| Immigrants | Uganda | 88.0 /100 | #143 | Excellent 24.9% |
| Chippewa | 86.9 /100 | #144 | Excellent 25.0% |
| Comanche | 85.2 /100 | #145 | Excellent 25.0% |
| South Americans | 85.2 /100 | #146 | Excellent 25.0% |
| Malaysians | 84.9 /100 | #147 | Excellent 25.0% |
| Iroquois | 83.9 /100 | #148 | Excellent 25.1% |
| Immigrants | Peru | 82.6 /100 | #149 | Excellent 25.1% |
| Immigrants | Immigrants | 82.3 /100 | #150 | Excellent 25.1% |
| Taiwanese | 81.6 /100 | #151 | Excellent 25.1% |
| Uruguayans | 81.3 /100 | #152 | Excellent 25.2% |
| Blackfeet | 78.1 /100 | #153 | Good 25.2% |