Iraqi vs Immigrants from Eritrea Median Family Income
COMPARE
Iraqi
Immigrants from Eritrea
Median Family Income
Median Family Income Comparison
Iraqis
Immigrants from Eritrea
$100,658
MEDIAN FAMILY INCOME
26.3/ 100
METRIC RATING
193rd/ 347
METRIC RANK
$102,823
MEDIAN FAMILY INCOME
51.9/ 100
METRIC RATING
172nd/ 347
METRIC RANK
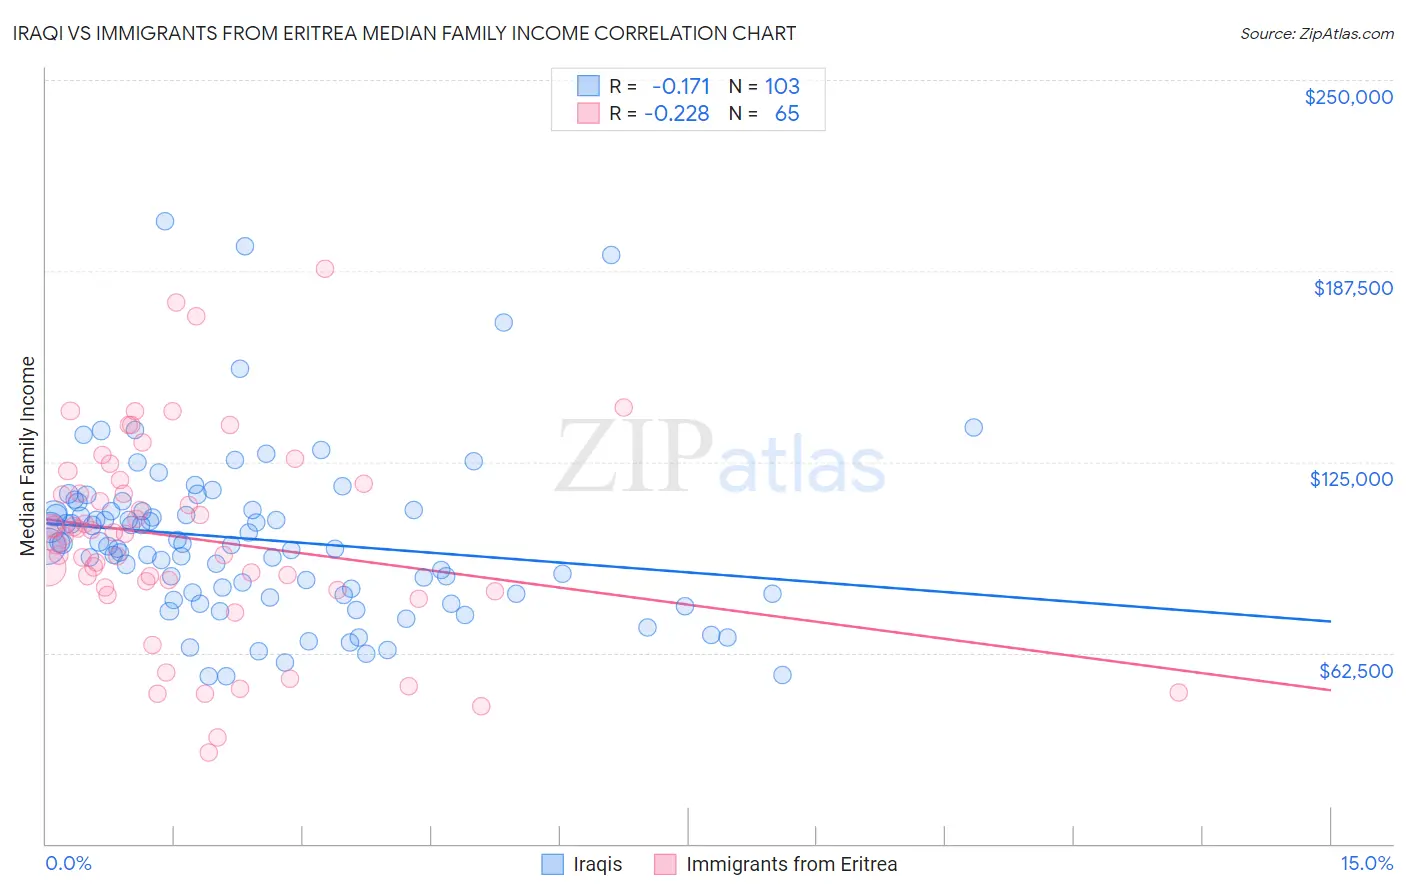
Iraqi vs Immigrants from Eritrea Median Family Income Correlation Chart
The statistical analysis conducted on geographies consisting of 170,585,790 people shows a poor negative correlation between the proportion of Iraqis and median family income in the United States with a correlation coefficient (R) of -0.171 and weighted average of $100,658. Similarly, the statistical analysis conducted on geographies consisting of 104,842,839 people shows a weak negative correlation between the proportion of Immigrants from Eritrea and median family income in the United States with a correlation coefficient (R) of -0.228 and weighted average of $102,823, a difference of 2.1%.
Median Family Income Correlation Summary
| Measurement | Iraqi | Immigrants from Eritrea |
| Minimum | $54,690 | $29,777 |
| Maximum | $203,844 | $188,047 |
| Range | $149,154 | $158,270 |
| Mean | $99,589 | $99,919 |
| Median | $97,704 | $101,536 |
| Interquartile 25% (IQ1) | $81,823 | $83,487 |
| Interquartile 75% (IQ3) | $109,149 | $118,485 |
| Interquartile Range (IQR) | $27,326 | $34,998 |
| Standard Deviation (Sample) | $27,377 | $32,848 |
| Standard Deviation (Population) | $27,244 | $32,595 |
Similar Demographics by Median Family Income
Demographics Similar to Iraqis by Median Family Income
In terms of median family income, the demographic groups most similar to Iraqis are Uruguayan ($100,656, a difference of 0.0%), Immigrants from Kenya ($100,679, a difference of 0.020%), Colombian ($100,750, a difference of 0.090%), Immigrants from South America ($100,414, a difference of 0.24%), and Immigrants ($100,962, a difference of 0.30%).
| Demographics | Rating | Rank | Median Family Income |
| Celtics | 31.3 /100 | #186 | Fair $101,139 |
| Tlingit-Haida | 30.8 /100 | #187 | Fair $101,092 |
| Guamanians/Chamorros | 30.5 /100 | #188 | Fair $101,061 |
| Immigrants | Portugal | 29.6 /100 | #189 | Fair $100,984 |
| Immigrants | Immigrants | 29.4 /100 | #190 | Fair $100,962 |
| Colombians | 27.2 /100 | #191 | Fair $100,750 |
| Immigrants | Kenya | 26.5 /100 | #192 | Fair $100,679 |
| Iraqis | 26.3 /100 | #193 | Fair $100,658 |
| Uruguayans | 26.3 /100 | #194 | Fair $100,656 |
| Immigrants | South America | 23.9 /100 | #195 | Fair $100,414 |
| Samoans | 23.3 /100 | #196 | Fair $100,344 |
| Immigrants | Cameroon | 22.8 /100 | #197 | Fair $100,289 |
| Immigrants | Africa | 22.5 /100 | #198 | Fair $100,256 |
| Yugoslavians | 21.3 /100 | #199 | Fair $100,119 |
| Spanish | 20.1 /100 | #200 | Fair $99,977 |
Demographics Similar to Immigrants from Eritrea by Median Family Income
In terms of median family income, the demographic groups most similar to Immigrants from Eritrea are Belgian ($102,788, a difference of 0.030%), Finnish ($102,676, a difference of 0.14%), Alsatian ($103,010, a difference of 0.18%), Immigrants from Uzbekistan ($103,197, a difference of 0.36%), and Immigrants from Eastern Africa ($102,451, a difference of 0.36%).
| Demographics | Rating | Rank | Median Family Income |
| Slovaks | 63.1 /100 | #165 | Good $103,729 |
| English | 62.6 /100 | #166 | Good $103,684 |
| South American Indians | 61.9 /100 | #167 | Good $103,624 |
| Immigrants | Peru | 60.8 /100 | #168 | Good $103,534 |
| Czechoslovakians | 57.6 /100 | #169 | Average $103,273 |
| Immigrants | Uzbekistan | 56.6 /100 | #170 | Average $103,197 |
| Alsatians | 54.3 /100 | #171 | Average $103,010 |
| Immigrants | Eritrea | 51.9 /100 | #172 | Average $102,823 |
| Belgians | 51.4 /100 | #173 | Average $102,788 |
| Finns | 50.0 /100 | #174 | Average $102,676 |
| Immigrants | Eastern Africa | 47.1 /100 | #175 | Average $102,451 |
| French | 46.1 /100 | #176 | Average $102,368 |
| Germans | 44.6 /100 | #177 | Average $102,254 |
| Welsh | 43.3 /100 | #178 | Average $102,151 |
| South Americans | 39.7 /100 | #179 | Fair $101,856 |