Iraqi vs Spanish American Indian Median Family Income
COMPARE
Iraqi
Spanish American Indian
Median Family Income
Median Family Income Comparison
Iraqis
Spanish American Indians
$100,658
MEDIAN FAMILY INCOME
26.3/ 100
METRIC RATING
193rd/ 347
METRIC RANK
$85,728
MEDIAN FAMILY INCOME
0.0/ 100
METRIC RATING
302nd/ 347
METRIC RANK
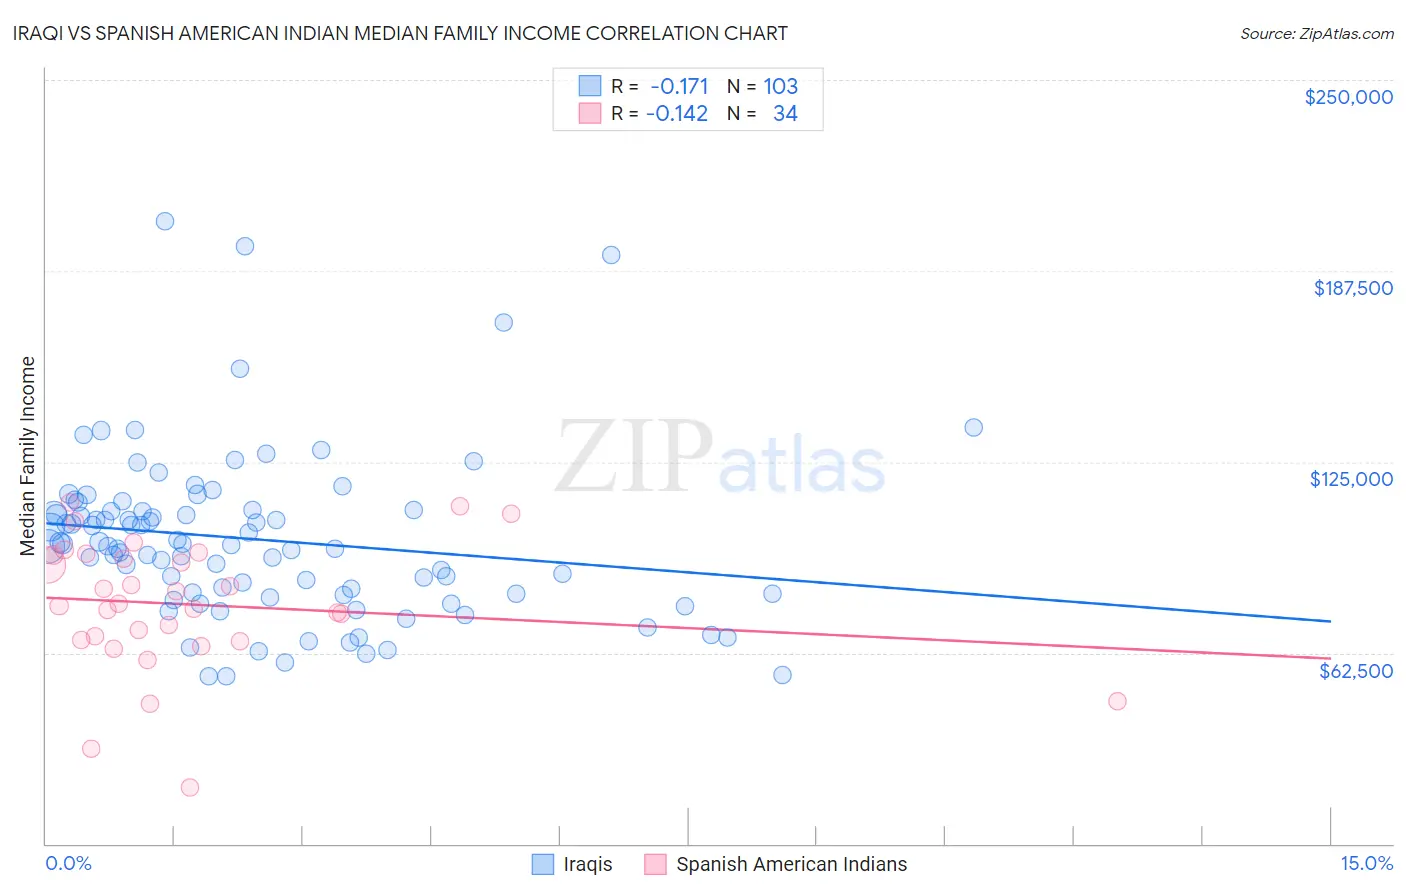
Iraqi vs Spanish American Indian Median Family Income Correlation Chart
The statistical analysis conducted on geographies consisting of 170,585,790 people shows a poor negative correlation between the proportion of Iraqis and median family income in the United States with a correlation coefficient (R) of -0.171 and weighted average of $100,658. Similarly, the statistical analysis conducted on geographies consisting of 73,144,470 people shows a poor negative correlation between the proportion of Spanish American Indians and median family income in the United States with a correlation coefficient (R) of -0.142 and weighted average of $85,728, a difference of 17.4%.
Median Family Income Correlation Summary
| Measurement | Iraqi | Spanish American Indian |
| Minimum | $54,690 | $18,487 |
| Maximum | $203,844 | $111,586 |
| Range | $149,154 | $93,099 |
| Mean | $99,589 | $78,286 |
| Median | $97,704 | $78,276 |
| Interquartile 25% (IQ1) | $81,823 | $66,839 |
| Interquartile 75% (IQ3) | $109,149 | $94,568 |
| Interquartile Range (IQR) | $27,326 | $27,730 |
| Standard Deviation (Sample) | $27,377 | $21,408 |
| Standard Deviation (Population) | $27,244 | $21,091 |
Similar Demographics by Median Family Income
Demographics Similar to Iraqis by Median Family Income
In terms of median family income, the demographic groups most similar to Iraqis are Uruguayan ($100,656, a difference of 0.0%), Immigrants from Kenya ($100,679, a difference of 0.020%), Colombian ($100,750, a difference of 0.090%), Immigrants from South America ($100,414, a difference of 0.24%), and Immigrants ($100,962, a difference of 0.30%).
| Demographics | Rating | Rank | Median Family Income |
| Celtics | 31.3 /100 | #186 | Fair $101,139 |
| Tlingit-Haida | 30.8 /100 | #187 | Fair $101,092 |
| Guamanians/Chamorros | 30.5 /100 | #188 | Fair $101,061 |
| Immigrants | Portugal | 29.6 /100 | #189 | Fair $100,984 |
| Immigrants | Immigrants | 29.4 /100 | #190 | Fair $100,962 |
| Colombians | 27.2 /100 | #191 | Fair $100,750 |
| Immigrants | Kenya | 26.5 /100 | #192 | Fair $100,679 |
| Iraqis | 26.3 /100 | #193 | Fair $100,658 |
| Uruguayans | 26.3 /100 | #194 | Fair $100,656 |
| Immigrants | South America | 23.9 /100 | #195 | Fair $100,414 |
| Samoans | 23.3 /100 | #196 | Fair $100,344 |
| Immigrants | Cameroon | 22.8 /100 | #197 | Fair $100,289 |
| Immigrants | Africa | 22.5 /100 | #198 | Fair $100,256 |
| Yugoslavians | 21.3 /100 | #199 | Fair $100,119 |
| Spanish | 20.1 /100 | #200 | Fair $99,977 |
Demographics Similar to Spanish American Indians by Median Family Income
In terms of median family income, the demographic groups most similar to Spanish American Indians are Colville ($85,792, a difference of 0.070%), Hispanic or Latino ($85,647, a difference of 0.090%), Mexican ($85,618, a difference of 0.13%), Paiute ($85,414, a difference of 0.37%), and Immigrants from Dominica ($85,411, a difference of 0.37%).
| Demographics | Rating | Rank | Median Family Income |
| Yaqui | 0.0 /100 | #295 | Tragic $87,289 |
| Immigrants | Guatemala | 0.0 /100 | #296 | Tragic $87,191 |
| Cajuns | 0.0 /100 | #297 | Tragic $87,157 |
| Immigrants | Latin America | 0.0 /100 | #298 | Tragic $86,989 |
| Chippewa | 0.0 /100 | #299 | Tragic $86,852 |
| Ottawa | 0.0 /100 | #300 | Tragic $86,380 |
| Colville | 0.0 /100 | #301 | Tragic $85,792 |
| Spanish American Indians | 0.0 /100 | #302 | Tragic $85,728 |
| Hispanics or Latinos | 0.0 /100 | #303 | Tragic $85,647 |
| Mexicans | 0.0 /100 | #304 | Tragic $85,618 |
| Paiute | 0.0 /100 | #305 | Tragic $85,414 |
| Immigrants | Dominica | 0.0 /100 | #306 | Tragic $85,411 |
| Chickasaw | 0.0 /100 | #307 | Tragic $85,356 |
| U.S. Virgin Islanders | 0.0 /100 | #308 | Tragic $85,294 |
| Haitians | 0.0 /100 | #309 | Tragic $85,218 |