Iraqi vs Immigrants from Eritrea Master's Degree
COMPARE
Iraqi
Immigrants from Eritrea
Master's Degree
Master's Degree Comparison
Iraqis
Immigrants from Eritrea
15.5%
MASTER'S DEGREE
77.3/ 100
METRIC RATING
151st/ 347
METRIC RANK
16.4%
MASTER'S DEGREE
95.5/ 100
METRIC RATING
124th/ 347
METRIC RANK
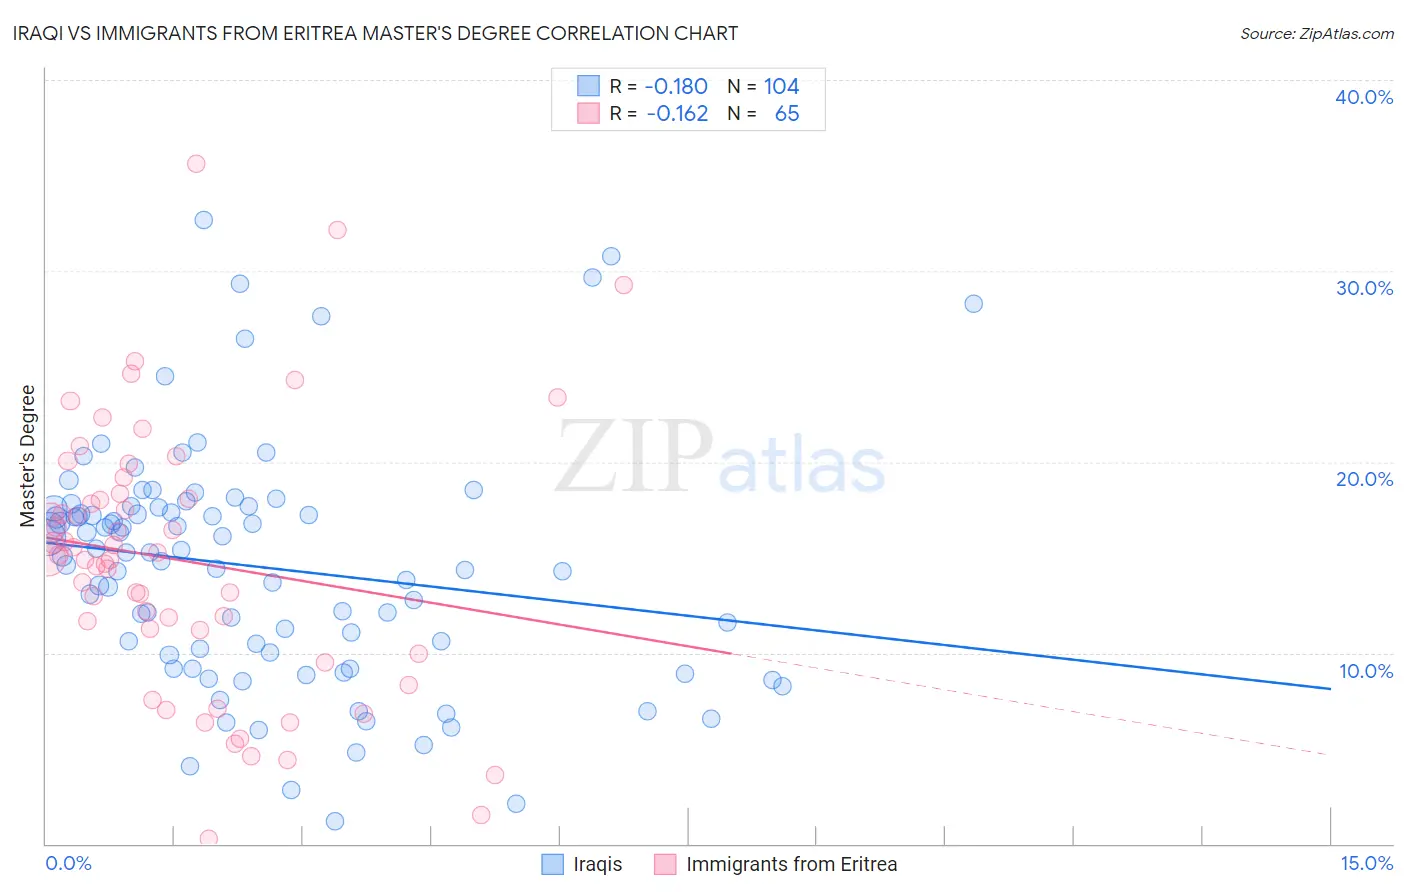
Iraqi vs Immigrants from Eritrea Master's Degree Correlation Chart
The statistical analysis conducted on geographies consisting of 170,638,714 people shows a poor negative correlation between the proportion of Iraqis and percentage of population with at least master's degree education in the United States with a correlation coefficient (R) of -0.180 and weighted average of 15.5%. Similarly, the statistical analysis conducted on geographies consisting of 104,847,630 people shows a poor negative correlation between the proportion of Immigrants from Eritrea and percentage of population with at least master's degree education in the United States with a correlation coefficient (R) of -0.162 and weighted average of 16.4%, a difference of 5.6%.
Master's Degree Correlation Summary
| Measurement | Iraqi | Immigrants from Eritrea |
| Minimum | 1.1% | 0.25% |
| Maximum | 32.7% | 35.6% |
| Range | 31.5% | 35.4% |
| Mean | 14.5% | 14.8% |
| Median | 15.2% | 15.0% |
| Interquartile 25% (IQ1) | 9.9% | 10.6% |
| Interquartile 75% (IQ3) | 17.6% | 18.2% |
| Interquartile Range (IQR) | 7.7% | 7.6% |
| Standard Deviation (Sample) | 6.2% | 7.0% |
| Standard Deviation (Population) | 6.2% | 7.0% |
Similar Demographics by Master's Degree
Demographics Similar to Iraqis by Master's Degree
In terms of master's degree, the demographic groups most similar to Iraqis are Slavic (15.5%, a difference of 0.050%), Icelander (15.5%, a difference of 0.080%), Slovene (15.5%, a difference of 0.12%), Immigrants from Senegal (15.5%, a difference of 0.16%), and Ghanaian (15.5%, a difference of 0.16%).
| Demographics | Rating | Rank | Master's Degree |
| Canadians | 83.3 /100 | #144 | Excellent 15.7% |
| South Americans | 81.3 /100 | #145 | Excellent 15.6% |
| Immigrants | Afghanistan | 79.4 /100 | #146 | Good 15.6% |
| Hungarians | 79.1 /100 | #147 | Good 15.6% |
| Immigrants | Senegal | 78.2 /100 | #148 | Good 15.5% |
| Ghanaians | 78.2 /100 | #149 | Good 15.5% |
| Slovenes | 78.0 /100 | #150 | Good 15.5% |
| Iraqis | 77.3 /100 | #151 | Good 15.5% |
| Slavs | 77.0 /100 | #152 | Good 15.5% |
| Icelanders | 76.8 /100 | #153 | Good 15.5% |
| Immigrants | South America | 76.3 /100 | #154 | Good 15.5% |
| Immigrants | Bangladesh | 76.1 /100 | #155 | Good 15.5% |
| Bermudans | 73.9 /100 | #156 | Good 15.4% |
| Immigrants | Cameroon | 71.7 /100 | #157 | Good 15.4% |
| Immigrants | Poland | 71.5 /100 | #158 | Good 15.4% |
Demographics Similar to Immigrants from Eritrea by Master's Degree
In terms of master's degree, the demographic groups most similar to Immigrants from Eritrea are Croatian (16.4%, a difference of 0.070%), Italian (16.4%, a difference of 0.070%), British (16.4%, a difference of 0.080%), Immigrants from Eastern Africa (16.3%, a difference of 0.19%), and Palestinian (16.3%, a difference of 0.45%).
| Demographics | Rating | Rank | Master's Degree |
| Immigrants | Moldova | 97.2 /100 | #117 | Exceptional 16.6% |
| Brazilians | 96.8 /100 | #118 | Exceptional 16.5% |
| Jordanians | 96.5 /100 | #119 | Exceptional 16.5% |
| Lebanese | 96.4 /100 | #120 | Exceptional 16.5% |
| Afghans | 96.2 /100 | #121 | Exceptional 16.5% |
| British | 95.6 /100 | #122 | Exceptional 16.4% |
| Croatians | 95.6 /100 | #123 | Exceptional 16.4% |
| Immigrants | Eritrea | 95.5 /100 | #124 | Exceptional 16.4% |
| Italians | 95.4 /100 | #125 | Exceptional 16.4% |
| Immigrants | Eastern Africa | 95.2 /100 | #126 | Exceptional 16.3% |
| Palestinians | 94.8 /100 | #127 | Exceptional 16.3% |
| Immigrants | Sierra Leone | 94.7 /100 | #128 | Exceptional 16.3% |
| Immigrants | Syria | 93.3 /100 | #129 | Exceptional 16.2% |
| Immigrants | Jordan | 92.7 /100 | #130 | Exceptional 16.1% |
| Taiwanese | 91.9 /100 | #131 | Exceptional 16.1% |