Iraqi vs Immigrants from Singapore Median Family Income
COMPARE
Iraqi
Immigrants from Singapore
Median Family Income
Median Family Income Comparison
Iraqis
Immigrants from Singapore
$100,658
MEDIAN FAMILY INCOME
26.3/ 100
METRIC RATING
193rd/ 347
METRIC RANK
$134,818
MEDIAN FAMILY INCOME
100.0/ 100
METRIC RATING
3rd/ 347
METRIC RANK
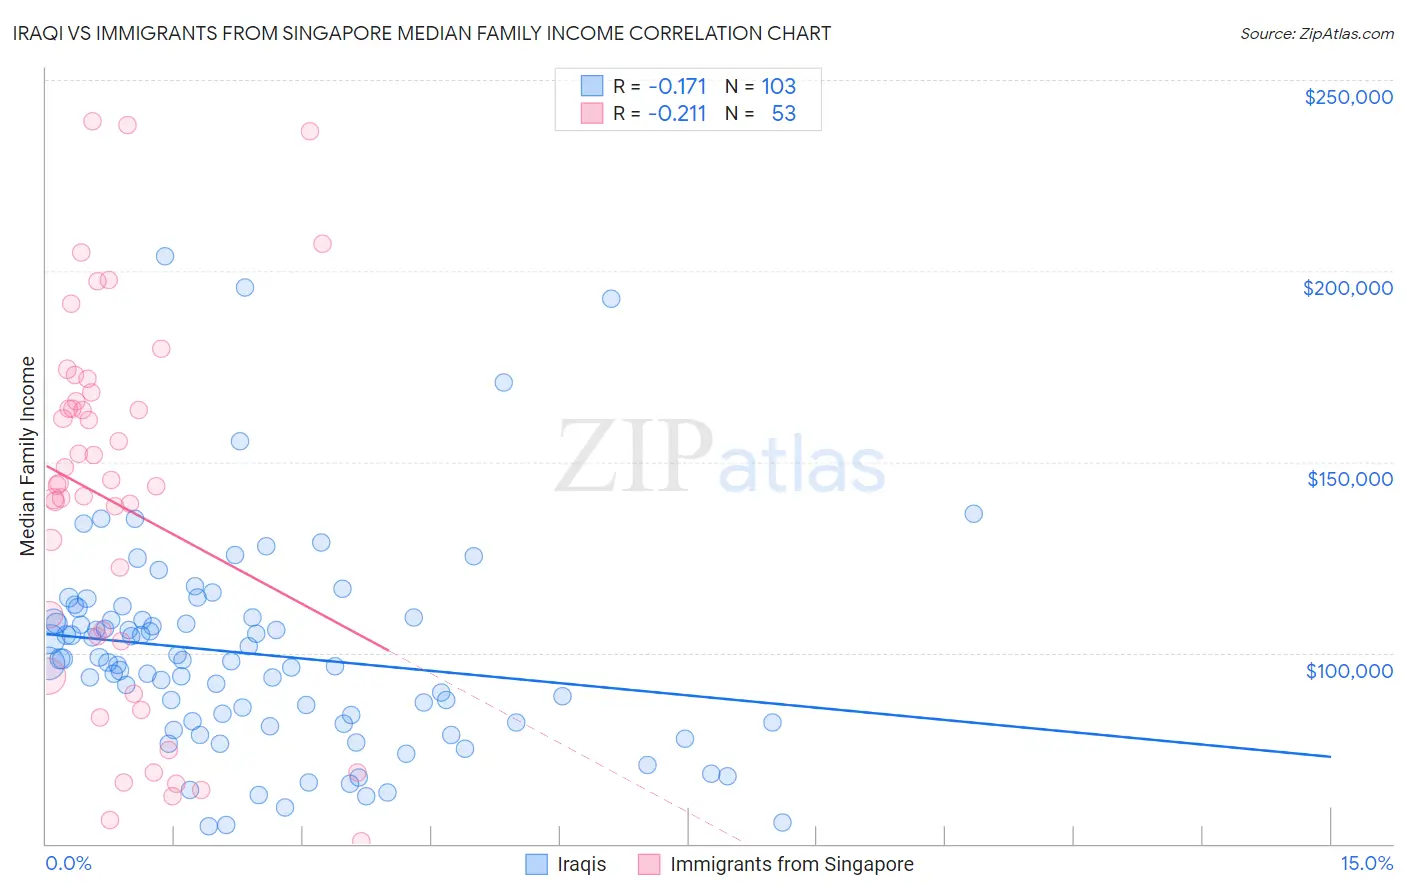
Iraqi vs Immigrants from Singapore Median Family Income Correlation Chart
The statistical analysis conducted on geographies consisting of 170,585,790 people shows a poor negative correlation between the proportion of Iraqis and median family income in the United States with a correlation coefficient (R) of -0.171 and weighted average of $100,658. Similarly, the statistical analysis conducted on geographies consisting of 137,416,913 people shows a weak negative correlation between the proportion of Immigrants from Singapore and median family income in the United States with a correlation coefficient (R) of -0.211 and weighted average of $134,818, a difference of 33.9%.
Median Family Income Correlation Summary
| Measurement | Iraqi | Immigrants from Singapore |
| Minimum | $54,690 | $50,694 |
| Maximum | $203,844 | $239,159 |
| Range | $149,154 | $188,465 |
| Mean | $99,589 | $138,690 |
| Median | $97,704 | $144,010 |
| Interquartile 25% (IQ1) | $81,823 | $98,407 |
| Interquartile 75% (IQ3) | $109,149 | $166,932 |
| Interquartile Range (IQR) | $27,326 | $68,525 |
| Standard Deviation (Sample) | $27,377 | $49,034 |
| Standard Deviation (Population) | $27,244 | $48,569 |
Similar Demographics by Median Family Income
Demographics Similar to Iraqis by Median Family Income
In terms of median family income, the demographic groups most similar to Iraqis are Uruguayan ($100,656, a difference of 0.0%), Immigrants from Kenya ($100,679, a difference of 0.020%), Colombian ($100,750, a difference of 0.090%), Immigrants from South America ($100,414, a difference of 0.24%), and Immigrants ($100,962, a difference of 0.30%).
| Demographics | Rating | Rank | Median Family Income |
| Celtics | 31.3 /100 | #186 | Fair $101,139 |
| Tlingit-Haida | 30.8 /100 | #187 | Fair $101,092 |
| Guamanians/Chamorros | 30.5 /100 | #188 | Fair $101,061 |
| Immigrants | Portugal | 29.6 /100 | #189 | Fair $100,984 |
| Immigrants | Immigrants | 29.4 /100 | #190 | Fair $100,962 |
| Colombians | 27.2 /100 | #191 | Fair $100,750 |
| Immigrants | Kenya | 26.5 /100 | #192 | Fair $100,679 |
| Iraqis | 26.3 /100 | #193 | Fair $100,658 |
| Uruguayans | 26.3 /100 | #194 | Fair $100,656 |
| Immigrants | South America | 23.9 /100 | #195 | Fair $100,414 |
| Samoans | 23.3 /100 | #196 | Fair $100,344 |
| Immigrants | Cameroon | 22.8 /100 | #197 | Fair $100,289 |
| Immigrants | Africa | 22.5 /100 | #198 | Fair $100,256 |
| Yugoslavians | 21.3 /100 | #199 | Fair $100,119 |
| Spanish | 20.1 /100 | #200 | Fair $99,977 |
Demographics Similar to Immigrants from Singapore by Median Family Income
In terms of median family income, the demographic groups most similar to Immigrants from Singapore are Immigrants from India ($134,028, a difference of 0.59%), Iranian ($133,839, a difference of 0.73%), Immigrants from Taiwan ($136,949, a difference of 1.6%), Filipino ($138,397, a difference of 2.6%), and Thai ($131,281, a difference of 2.7%).
| Demographics | Rating | Rank | Median Family Income |
| Filipinos | 100.0 /100 | #1 | Exceptional $138,397 |
| Immigrants | Taiwan | 100.0 /100 | #2 | Exceptional $136,949 |
| Immigrants | Singapore | 100.0 /100 | #3 | Exceptional $134,818 |
| Immigrants | India | 100.0 /100 | #4 | Exceptional $134,028 |
| Iranians | 100.0 /100 | #5 | Exceptional $133,839 |
| Thais | 100.0 /100 | #6 | Exceptional $131,281 |
| Immigrants | Hong Kong | 100.0 /100 | #7 | Exceptional $131,067 |
| Immigrants | Iran | 100.0 /100 | #8 | Exceptional $130,894 |
| Okinawans | 100.0 /100 | #9 | Exceptional $129,979 |
| Immigrants | Ireland | 100.0 /100 | #10 | Exceptional $127,584 |
| Immigrants | Israel | 100.0 /100 | #11 | Exceptional $127,430 |
| Cypriots | 100.0 /100 | #12 | Exceptional $127,064 |
| Immigrants | Australia | 100.0 /100 | #13 | Exceptional $126,620 |
| Immigrants | South Central Asia | 100.0 /100 | #14 | Exceptional $125,956 |
| Eastern Europeans | 100.0 /100 | #15 | Exceptional $125,546 |