South American vs Immigrants from Eritrea Median Family Income
COMPARE
South American
Immigrants from Eritrea
Median Family Income
Median Family Income Comparison
South Americans
Immigrants from Eritrea
$101,856
MEDIAN FAMILY INCOME
39.7/ 100
METRIC RATING
179th/ 347
METRIC RANK
$102,823
MEDIAN FAMILY INCOME
51.9/ 100
METRIC RATING
172nd/ 347
METRIC RANK
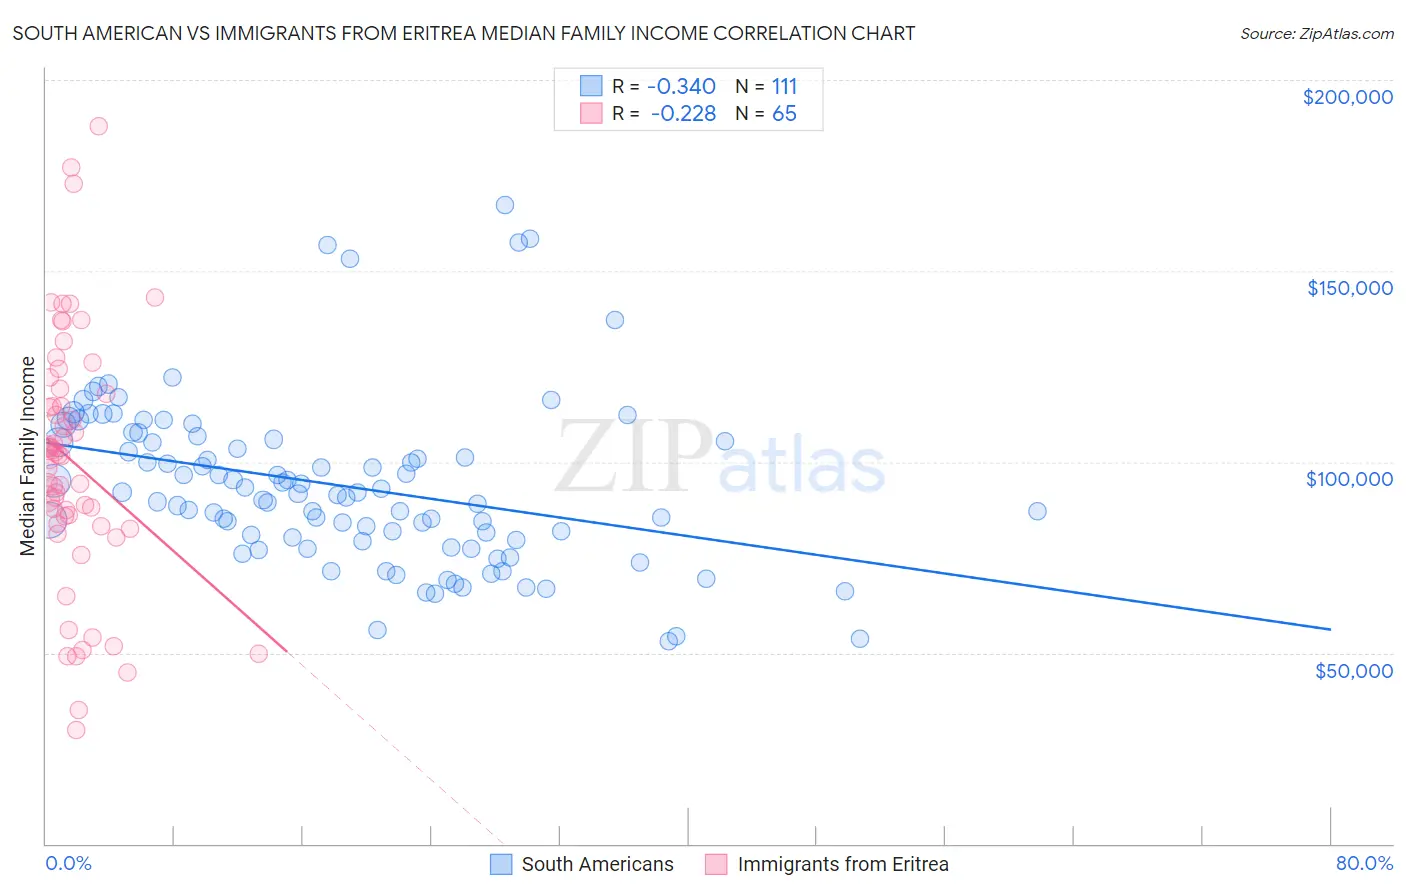
South American vs Immigrants from Eritrea Median Family Income Correlation Chart
The statistical analysis conducted on geographies consisting of 493,360,337 people shows a mild negative correlation between the proportion of South Americans and median family income in the United States with a correlation coefficient (R) of -0.340 and weighted average of $101,856. Similarly, the statistical analysis conducted on geographies consisting of 104,842,839 people shows a weak negative correlation between the proportion of Immigrants from Eritrea and median family income in the United States with a correlation coefficient (R) of -0.228 and weighted average of $102,823, a difference of 0.95%.
Median Family Income Correlation Summary
| Measurement | South American | Immigrants from Eritrea |
| Minimum | $53,167 | $29,777 |
| Maximum | $167,114 | $188,047 |
| Range | $113,947 | $158,270 |
| Mean | $93,843 | $99,919 |
| Median | $91,692 | $101,536 |
| Interquartile 25% (IQ1) | $79,466 | $83,487 |
| Interquartile 75% (IQ3) | $105,899 | $118,485 |
| Interquartile Range (IQR) | $26,433 | $34,998 |
| Standard Deviation (Sample) | $21,858 | $32,848 |
| Standard Deviation (Population) | $21,760 | $32,595 |
Demographics Similar to South Americans and Immigrants from Eritrea by Median Family Income
In terms of median family income, the demographic groups most similar to South Americans are French Canadian ($101,634, a difference of 0.22%), Spaniard ($101,617, a difference of 0.23%), Welsh ($102,151, a difference of 0.29%), Tsimshian ($101,543, a difference of 0.31%), and German ($102,254, a difference of 0.39%). Similarly, the demographic groups most similar to Immigrants from Eritrea are Belgian ($102,788, a difference of 0.030%), Finnish ($102,676, a difference of 0.14%), Alsatian ($103,010, a difference of 0.18%), Immigrants from Uzbekistan ($103,197, a difference of 0.36%), and Immigrants from Eastern Africa ($102,451, a difference of 0.36%).
| Demographics | Rating | Rank | Median Family Income |
| Slovaks | 63.1 /100 | #165 | Good $103,729 |
| English | 62.6 /100 | #166 | Good $103,684 |
| South American Indians | 61.9 /100 | #167 | Good $103,624 |
| Immigrants | Peru | 60.8 /100 | #168 | Good $103,534 |
| Czechoslovakians | 57.6 /100 | #169 | Average $103,273 |
| Immigrants | Uzbekistan | 56.6 /100 | #170 | Average $103,197 |
| Alsatians | 54.3 /100 | #171 | Average $103,010 |
| Immigrants | Eritrea | 51.9 /100 | #172 | Average $102,823 |
| Belgians | 51.4 /100 | #173 | Average $102,788 |
| Finns | 50.0 /100 | #174 | Average $102,676 |
| Immigrants | Eastern Africa | 47.1 /100 | #175 | Average $102,451 |
| French | 46.1 /100 | #176 | Average $102,368 |
| Germans | 44.6 /100 | #177 | Average $102,254 |
| Welsh | 43.3 /100 | #178 | Average $102,151 |
| South Americans | 39.7 /100 | #179 | Fair $101,856 |
| French Canadians | 37.0 /100 | #180 | Fair $101,634 |
| Spaniards | 36.8 /100 | #181 | Fair $101,617 |
| Tsimshian | 35.9 /100 | #182 | Fair $101,543 |
| Kenyans | 34.5 /100 | #183 | Fair $101,417 |
| Immigrants | Costa Rica | 33.7 /100 | #184 | Fair $101,354 |
| Dutch | 31.9 /100 | #185 | Fair $101,192 |