Immigrants from Kenya vs Immigrants from Eritrea Median Family Income
COMPARE
Immigrants from Kenya
Immigrants from Eritrea
Median Family Income
Median Family Income Comparison
Immigrants from Kenya
Immigrants from Eritrea
$100,679
MEDIAN FAMILY INCOME
26.5/ 100
METRIC RATING
192nd/ 347
METRIC RANK
$102,823
MEDIAN FAMILY INCOME
51.9/ 100
METRIC RATING
172nd/ 347
METRIC RANK
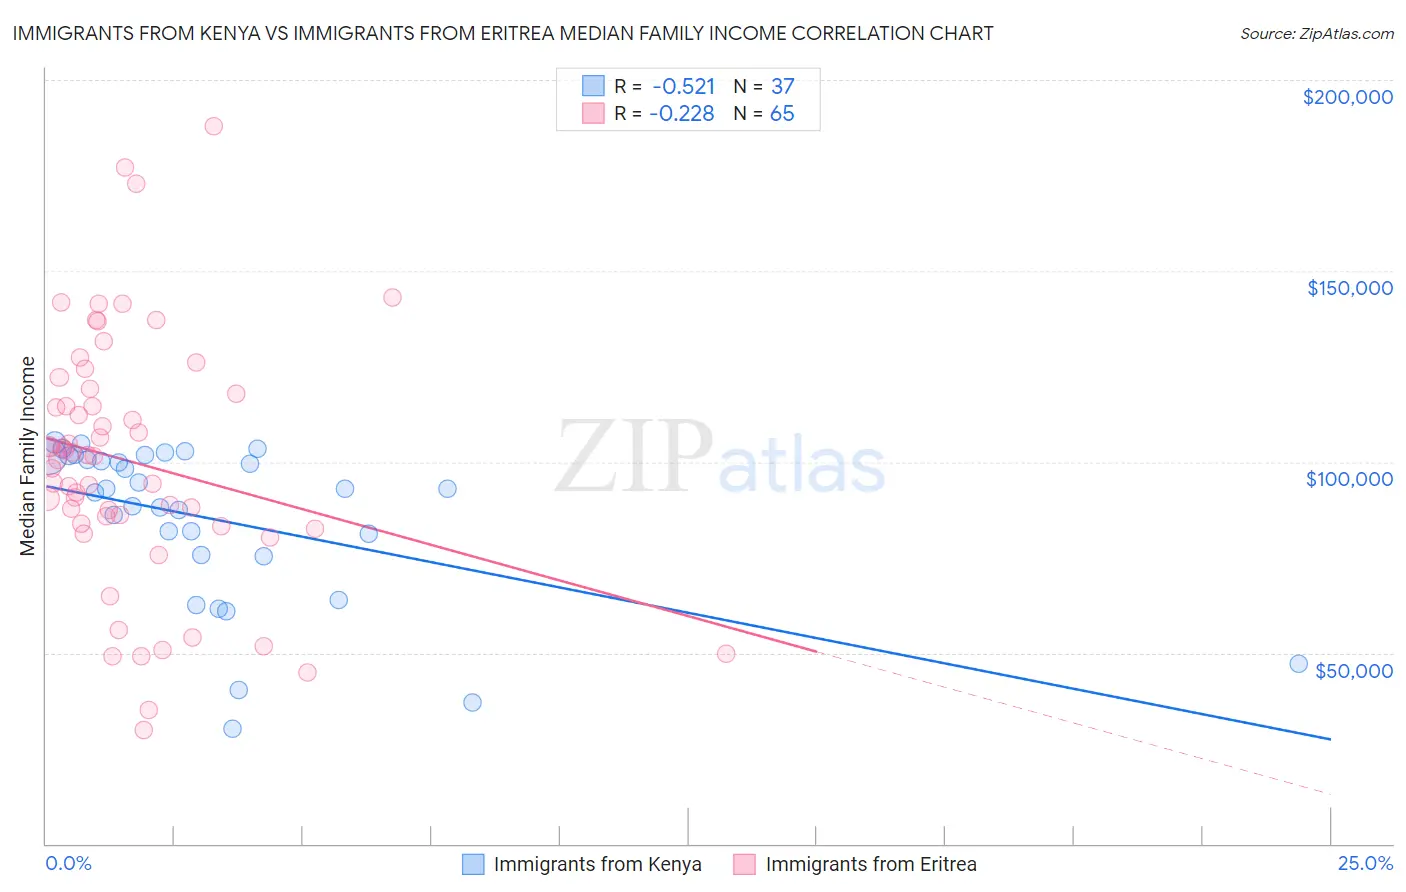
Immigrants from Kenya vs Immigrants from Eritrea Median Family Income Correlation Chart
The statistical analysis conducted on geographies consisting of 217,962,146 people shows a substantial negative correlation between the proportion of Immigrants from Kenya and median family income in the United States with a correlation coefficient (R) of -0.521 and weighted average of $100,679. Similarly, the statistical analysis conducted on geographies consisting of 104,842,839 people shows a weak negative correlation between the proportion of Immigrants from Eritrea and median family income in the United States with a correlation coefficient (R) of -0.228 and weighted average of $102,823, a difference of 2.1%.
Median Family Income Correlation Summary
| Measurement | Immigrants from Kenya | Immigrants from Eritrea |
| Minimum | $29,978 | $29,777 |
| Maximum | $105,113 | $188,047 |
| Range | $75,135 | $158,270 |
| Mean | $84,908 | $99,919 |
| Median | $92,944 | $101,536 |
| Interquartile 25% (IQ1) | $75,494 | $83,487 |
| Interquartile 75% (IQ3) | $101,628 | $118,485 |
| Interquartile Range (IQR) | $26,135 | $34,998 |
| Standard Deviation (Sample) | $20,915 | $32,848 |
| Standard Deviation (Population) | $20,630 | $32,595 |
Demographics Similar to Immigrants from Kenya and Immigrants from Eritrea by Median Family Income
In terms of median family income, the demographic groups most similar to Immigrants from Kenya are Colombian ($100,750, a difference of 0.070%), Immigrants ($100,962, a difference of 0.28%), Immigrants from Portugal ($100,984, a difference of 0.30%), Guamanian/Chamorro ($101,061, a difference of 0.38%), and Tlingit-Haida ($101,092, a difference of 0.41%). Similarly, the demographic groups most similar to Immigrants from Eritrea are Belgian ($102,788, a difference of 0.030%), Finnish ($102,676, a difference of 0.14%), Immigrants from Eastern Africa ($102,451, a difference of 0.36%), French ($102,368, a difference of 0.44%), and German ($102,254, a difference of 0.56%).
| Demographics | Rating | Rank | Median Family Income |
| Immigrants | Eritrea | 51.9 /100 | #172 | Average $102,823 |
| Belgians | 51.4 /100 | #173 | Average $102,788 |
| Finns | 50.0 /100 | #174 | Average $102,676 |
| Immigrants | Eastern Africa | 47.1 /100 | #175 | Average $102,451 |
| French | 46.1 /100 | #176 | Average $102,368 |
| Germans | 44.6 /100 | #177 | Average $102,254 |
| Welsh | 43.3 /100 | #178 | Average $102,151 |
| South Americans | 39.7 /100 | #179 | Fair $101,856 |
| French Canadians | 37.0 /100 | #180 | Fair $101,634 |
| Spaniards | 36.8 /100 | #181 | Fair $101,617 |
| Tsimshian | 35.9 /100 | #182 | Fair $101,543 |
| Kenyans | 34.5 /100 | #183 | Fair $101,417 |
| Immigrants | Costa Rica | 33.7 /100 | #184 | Fair $101,354 |
| Dutch | 31.9 /100 | #185 | Fair $101,192 |
| Celtics | 31.3 /100 | #186 | Fair $101,139 |
| Tlingit-Haida | 30.8 /100 | #187 | Fair $101,092 |
| Guamanians/Chamorros | 30.5 /100 | #188 | Fair $101,061 |
| Immigrants | Portugal | 29.6 /100 | #189 | Fair $100,984 |
| Immigrants | Immigrants | 29.4 /100 | #190 | Fair $100,962 |
| Colombians | 27.2 /100 | #191 | Fair $100,750 |
| Immigrants | Kenya | 26.5 /100 | #192 | Fair $100,679 |