Hawaiian vs Immigrants from Eritrea Median Family Income
COMPARE
Hawaiian
Immigrants from Eritrea
Median Family Income
Median Family Income Comparison
Hawaiians
Immigrants from Eritrea
$98,869
MEDIAN FAMILY INCOME
12.5/ 100
METRIC RATING
205th/ 347
METRIC RANK
$102,823
MEDIAN FAMILY INCOME
51.9/ 100
METRIC RATING
172nd/ 347
METRIC RANK
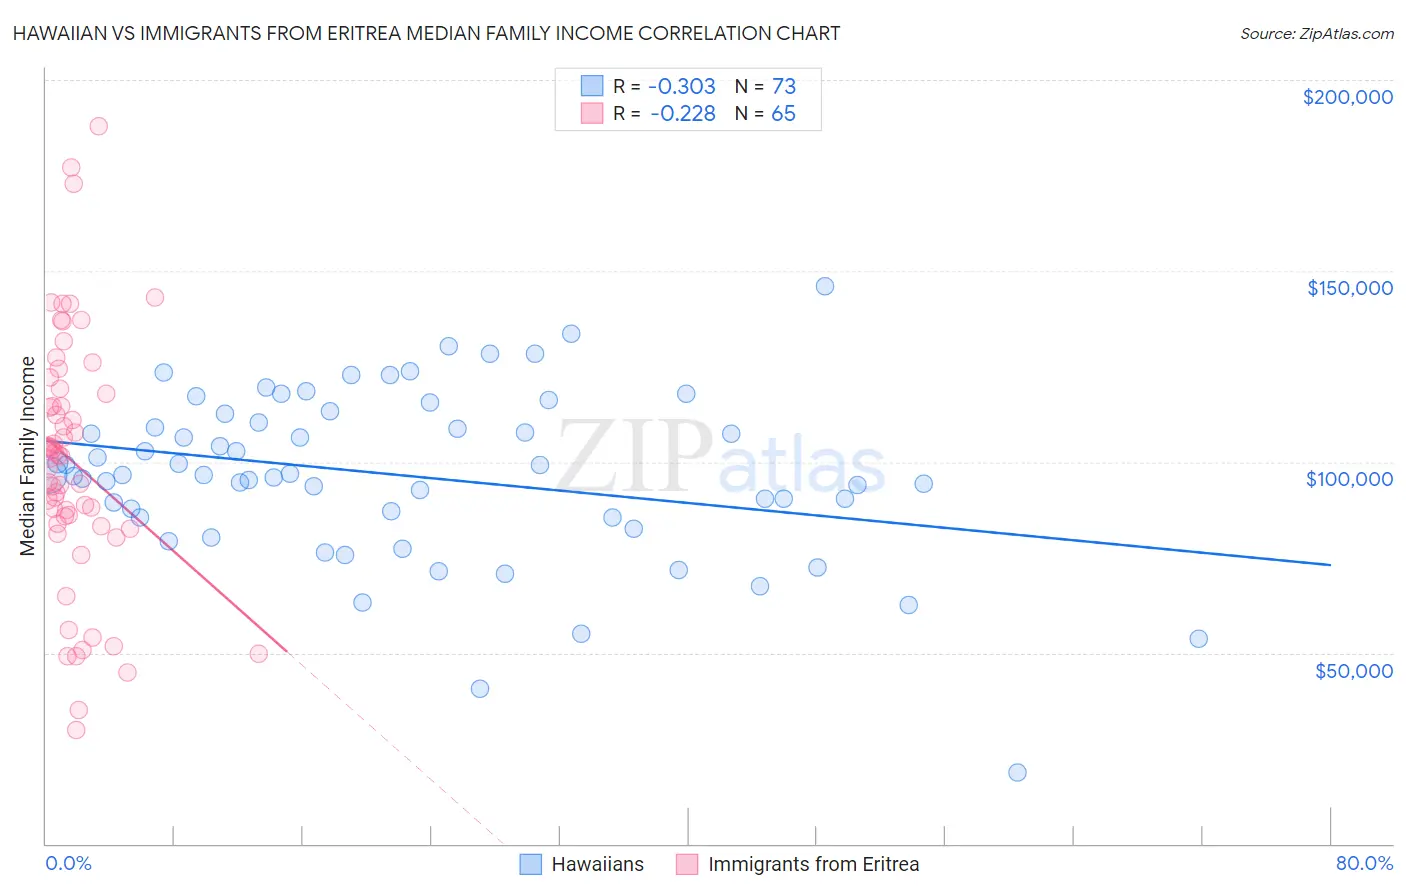
Hawaiian vs Immigrants from Eritrea Median Family Income Correlation Chart
The statistical analysis conducted on geographies consisting of 327,312,132 people shows a mild negative correlation between the proportion of Hawaiians and median family income in the United States with a correlation coefficient (R) of -0.303 and weighted average of $98,869. Similarly, the statistical analysis conducted on geographies consisting of 104,842,839 people shows a weak negative correlation between the proportion of Immigrants from Eritrea and median family income in the United States with a correlation coefficient (R) of -0.228 and weighted average of $102,823, a difference of 4.0%.
Median Family Income Correlation Summary
| Measurement | Hawaiian | Immigrants from Eritrea |
| Minimum | $18,796 | $29,777 |
| Maximum | $146,000 | $188,047 |
| Range | $127,204 | $158,270 |
| Mean | $96,414 | $99,919 |
| Median | $96,571 | $101,536 |
| Interquartile 25% (IQ1) | $85,564 | $83,487 |
| Interquartile 75% (IQ3) | $111,384 | $118,485 |
| Interquartile Range (IQR) | $25,820 | $34,998 |
| Standard Deviation (Sample) | $22,234 | $32,848 |
| Standard Deviation (Population) | $22,081 | $32,595 |
Similar Demographics by Median Family Income
Demographics Similar to Hawaiians by Median Family Income
In terms of median family income, the demographic groups most similar to Hawaiians are Ghanaian ($98,877, a difference of 0.010%), Immigrants from Iraq ($98,786, a difference of 0.080%), Aleut ($98,702, a difference of 0.17%), Immigrants from Uruguay ($98,205, a difference of 0.68%), and Scotch-Irish ($99,591, a difference of 0.73%).
| Demographics | Rating | Rank | Median Family Income |
| Immigrants | Africa | 22.5 /100 | #198 | Fair $100,256 |
| Yugoslavians | 21.3 /100 | #199 | Fair $100,119 |
| Spanish | 20.1 /100 | #200 | Fair $99,977 |
| Immigrants | Thailand | 19.0 /100 | #201 | Poor $99,840 |
| Whites/Caucasians | 18.7 /100 | #202 | Poor $99,800 |
| Scotch-Irish | 17.1 /100 | #203 | Poor $99,591 |
| Ghanaians | 12.6 /100 | #204 | Poor $98,877 |
| Hawaiians | 12.5 /100 | #205 | Poor $98,869 |
| Immigrants | Iraq | 12.1 /100 | #206 | Poor $98,786 |
| Aleuts | 11.6 /100 | #207 | Poor $98,702 |
| Immigrants | Uruguay | 9.2 /100 | #208 | Tragic $98,205 |
| Immigrants | Colombia | 8.7 /100 | #209 | Tragic $98,067 |
| Puget Sound Salish | 8.2 /100 | #210 | Tragic $97,958 |
| Immigrants | Sudan | 7.4 /100 | #211 | Tragic $97,737 |
| Panamanians | 7.2 /100 | #212 | Tragic $97,683 |
Demographics Similar to Immigrants from Eritrea by Median Family Income
In terms of median family income, the demographic groups most similar to Immigrants from Eritrea are Belgian ($102,788, a difference of 0.030%), Finnish ($102,676, a difference of 0.14%), Alsatian ($103,010, a difference of 0.18%), Immigrants from Uzbekistan ($103,197, a difference of 0.36%), and Immigrants from Eastern Africa ($102,451, a difference of 0.36%).
| Demographics | Rating | Rank | Median Family Income |
| Slovaks | 63.1 /100 | #165 | Good $103,729 |
| English | 62.6 /100 | #166 | Good $103,684 |
| South American Indians | 61.9 /100 | #167 | Good $103,624 |
| Immigrants | Peru | 60.8 /100 | #168 | Good $103,534 |
| Czechoslovakians | 57.6 /100 | #169 | Average $103,273 |
| Immigrants | Uzbekistan | 56.6 /100 | #170 | Average $103,197 |
| Alsatians | 54.3 /100 | #171 | Average $103,010 |
| Immigrants | Eritrea | 51.9 /100 | #172 | Average $102,823 |
| Belgians | 51.4 /100 | #173 | Average $102,788 |
| Finns | 50.0 /100 | #174 | Average $102,676 |
| Immigrants | Eastern Africa | 47.1 /100 | #175 | Average $102,451 |
| French | 46.1 /100 | #176 | Average $102,368 |
| Germans | 44.6 /100 | #177 | Average $102,254 |
| Welsh | 43.3 /100 | #178 | Average $102,151 |
| South Americans | 39.7 /100 | #179 | Fair $101,856 |