Iraqi vs Immigrants from Eritrea 9th Grade
COMPARE
Iraqi
Immigrants from Eritrea
9th Grade
9th Grade Comparison
Iraqis
Immigrants from Eritrea
94.9%
9TH GRADE
54.0/ 100
METRIC RATING
172nd/ 347
METRIC RANK
93.7%
9TH GRADE
0.1/ 100
METRIC RATING
278th/ 347
METRIC RANK
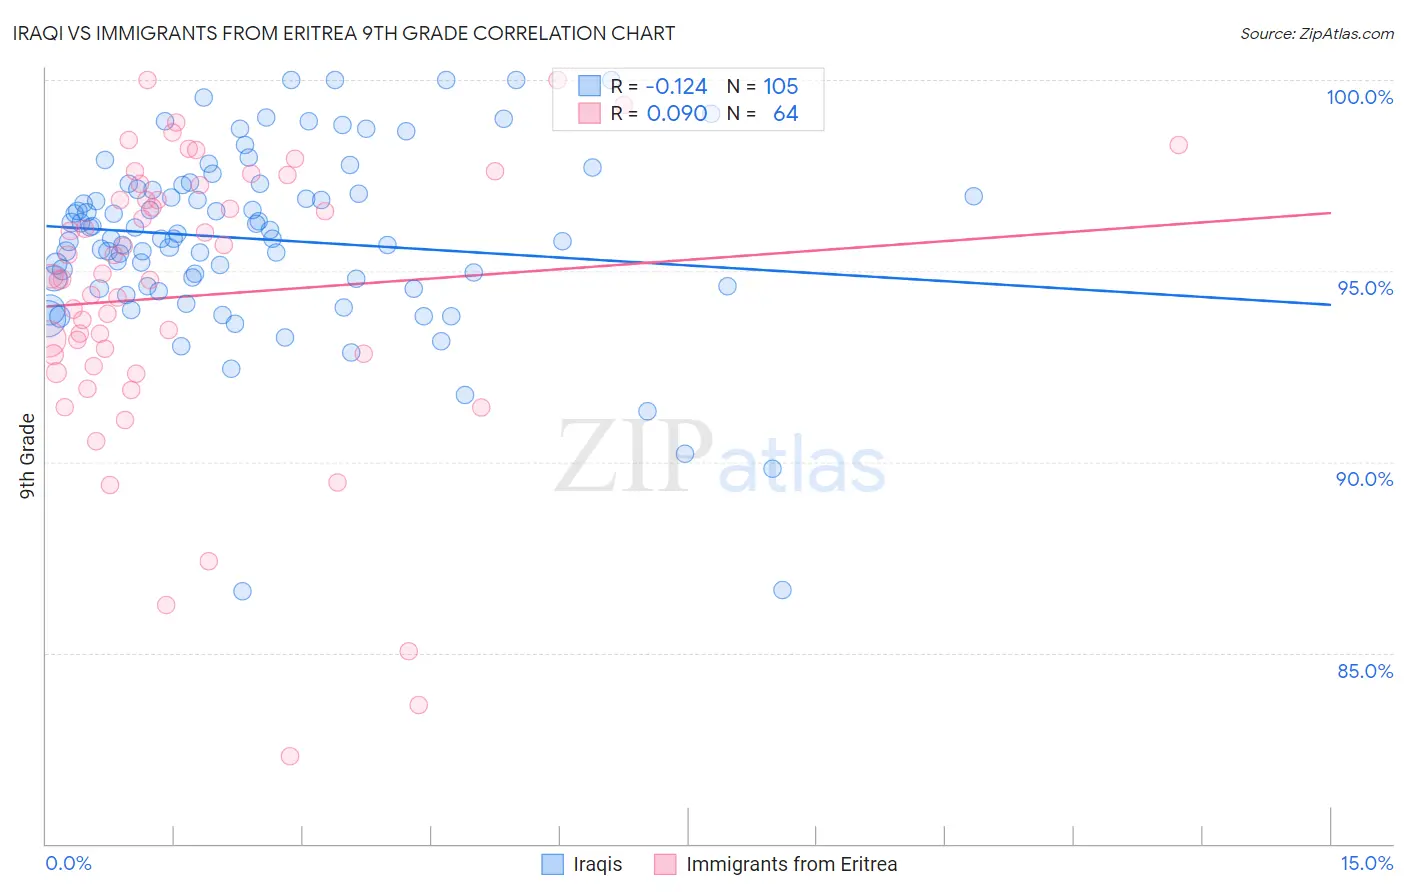
Iraqi vs Immigrants from Eritrea 9th Grade Correlation Chart
The statistical analysis conducted on geographies consisting of 170,614,457 people shows a poor negative correlation between the proportion of Iraqis and percentage of population with at least 9th grade education in the United States with a correlation coefficient (R) of -0.124 and weighted average of 94.9%. Similarly, the statistical analysis conducted on geographies consisting of 104,754,230 people shows a slight positive correlation between the proportion of Immigrants from Eritrea and percentage of population with at least 9th grade education in the United States with a correlation coefficient (R) of 0.090 and weighted average of 93.7%, a difference of 1.2%.
9th Grade Correlation Summary
| Measurement | Iraqi | Immigrants from Eritrea |
| Minimum | 86.6% | 82.3% |
| Maximum | 100.0% | 100.0% |
| Range | 13.4% | 17.7% |
| Mean | 95.8% | 94.3% |
| Median | 95.9% | 94.8% |
| Interquartile 25% (IQ1) | 94.6% | 92.7% |
| Interquartile 75% (IQ3) | 97.2% | 97.1% |
| Interquartile Range (IQR) | 2.6% | 4.4% |
| Standard Deviation (Sample) | 2.4% | 3.8% |
| Standard Deviation (Population) | 2.4% | 3.8% |
Similar Demographics by 9th Grade
Demographics Similar to Iraqis by 9th Grade
In terms of 9th grade, the demographic groups most similar to Iraqis are Cheyenne (94.9%, a difference of 0.020%), Alsatian (94.9%, a difference of 0.030%), Colville (94.9%, a difference of 0.030%), Immigrants from Egypt (94.9%, a difference of 0.030%), and Brazilian (94.9%, a difference of 0.030%).
| Demographics | Rating | Rank | 9th Grade |
| Blackfeet | 62.6 /100 | #165 | Good 95.0% |
| Ute | 62.6 /100 | #166 | Good 95.0% |
| Immigrants | Brazil | 61.1 /100 | #167 | Good 95.0% |
| Chileans | 60.7 /100 | #168 | Good 95.0% |
| Spaniards | 59.6 /100 | #169 | Average 94.9% |
| Alsatians | 58.6 /100 | #170 | Average 94.9% |
| Colville | 58.5 /100 | #171 | Average 94.9% |
| Iraqis | 54.0 /100 | #172 | Average 94.9% |
| Cheyenne | 51.5 /100 | #173 | Average 94.9% |
| Immigrants | Egypt | 50.0 /100 | #174 | Average 94.9% |
| Brazilians | 49.8 /100 | #175 | Average 94.9% |
| Immigrants | Spain | 49.1 /100 | #176 | Average 94.9% |
| Immigrants | Iraq | 47.8 /100 | #177 | Average 94.9% |
| Immigrants | Poland | 46.7 /100 | #178 | Average 94.9% |
| Immigrants | Venezuela | 46.5 /100 | #179 | Average 94.9% |
Demographics Similar to Immigrants from Eritrea by 9th Grade
In terms of 9th grade, the demographic groups most similar to Immigrants from Eritrea are Immigrants from Philippines (93.7%, a difference of 0.0%), West Indian (93.7%, a difference of 0.010%), Immigrants from Colombia (93.8%, a difference of 0.030%), Immigrants from South America (93.8%, a difference of 0.040%), and Peruvian (93.8%, a difference of 0.040%).
| Demographics | Rating | Rank | 9th Grade |
| Immigrants | Ghana | 0.2 /100 | #271 | Tragic 93.8% |
| Immigrants | Western Africa | 0.2 /100 | #272 | Tragic 93.8% |
| Immigrants | South America | 0.2 /100 | #273 | Tragic 93.8% |
| Peruvians | 0.2 /100 | #274 | Tragic 93.8% |
| Immigrants | Colombia | 0.2 /100 | #275 | Tragic 93.8% |
| West Indians | 0.2 /100 | #276 | Tragic 93.7% |
| Immigrants | Philippines | 0.1 /100 | #277 | Tragic 93.7% |
| Immigrants | Eritrea | 0.1 /100 | #278 | Tragic 93.7% |
| Trinidadians and Tobagonians | 0.1 /100 | #279 | Tragic 93.7% |
| Taiwanese | 0.1 /100 | #280 | Tragic 93.6% |
| Immigrants | Trinidad and Tobago | 0.1 /100 | #281 | Tragic 93.6% |
| Malaysians | 0.0 /100 | #282 | Tragic 93.5% |
| Barbadians | 0.0 /100 | #283 | Tragic 93.5% |
| Bangladeshis | 0.0 /100 | #284 | Tragic 93.4% |
| Immigrants | Peru | 0.0 /100 | #285 | Tragic 93.4% |