Immigrants from Guyana vs Immigrants from Eritrea Median Family Income
COMPARE
Immigrants from Guyana
Immigrants from Eritrea
Median Family Income
Median Family Income Comparison
Immigrants from Guyana
Immigrants from Eritrea
$92,513
MEDIAN FAMILY INCOME
0.6/ 100
METRIC RATING
253rd/ 347
METRIC RANK
$102,823
MEDIAN FAMILY INCOME
51.9/ 100
METRIC RATING
172nd/ 347
METRIC RANK
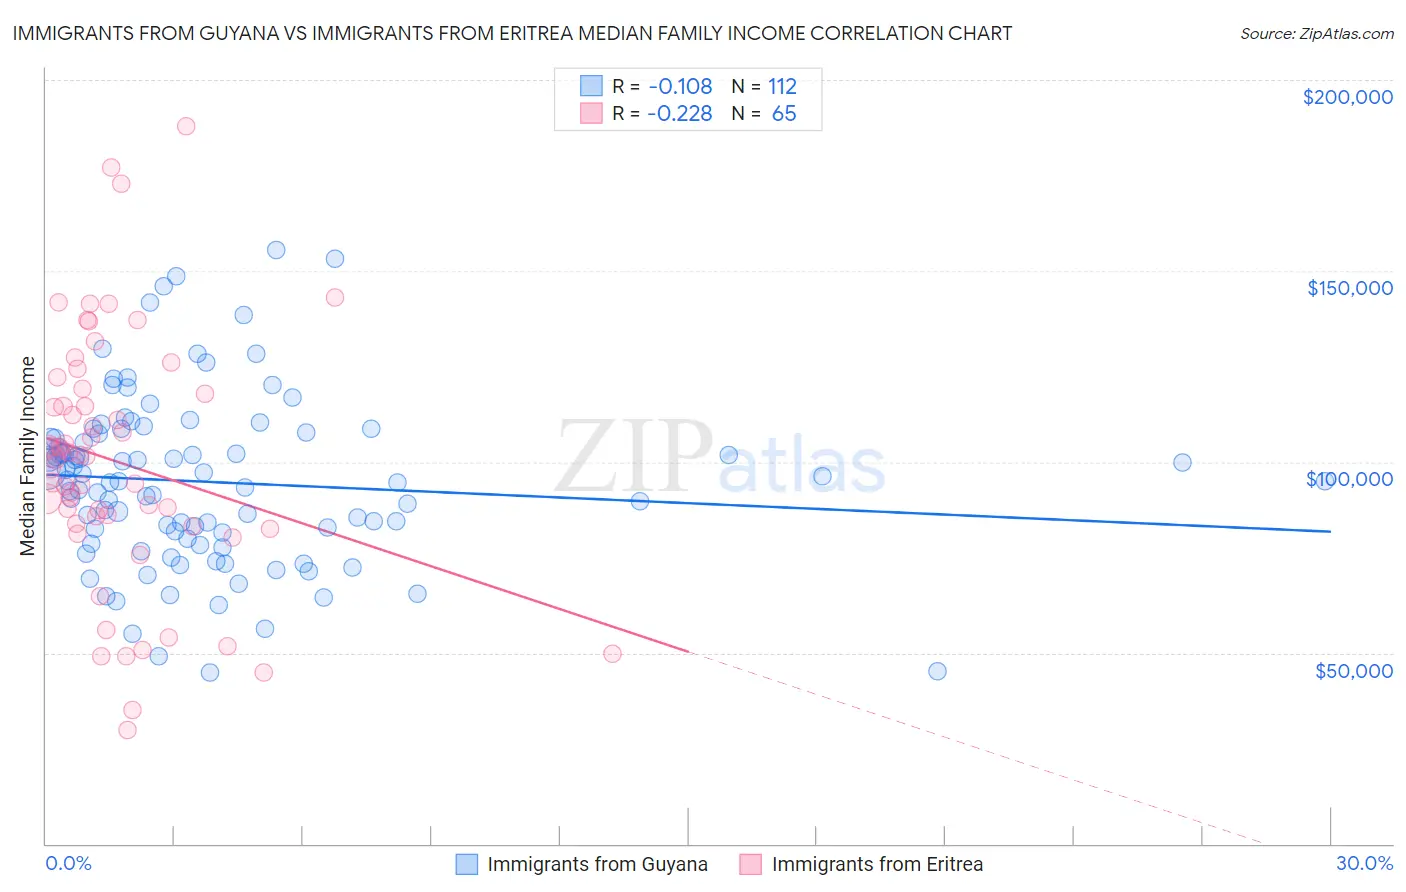
Immigrants from Guyana vs Immigrants from Eritrea Median Family Income Correlation Chart
The statistical analysis conducted on geographies consisting of 183,650,317 people shows a poor negative correlation between the proportion of Immigrants from Guyana and median family income in the United States with a correlation coefficient (R) of -0.108 and weighted average of $92,513. Similarly, the statistical analysis conducted on geographies consisting of 104,842,839 people shows a weak negative correlation between the proportion of Immigrants from Eritrea and median family income in the United States with a correlation coefficient (R) of -0.228 and weighted average of $102,823, a difference of 11.1%.
Median Family Income Correlation Summary
| Measurement | Immigrants from Guyana | Immigrants from Eritrea |
| Minimum | $44,715 | $29,777 |
| Maximum | $155,346 | $188,047 |
| Range | $110,631 | $158,270 |
| Mean | $94,705 | $99,919 |
| Median | $94,807 | $101,536 |
| Interquartile 25% (IQ1) | $80,722 | $83,487 |
| Interquartile 75% (IQ3) | $106,748 | $118,485 |
| Interquartile Range (IQR) | $26,026 | $34,998 |
| Standard Deviation (Sample) | $22,061 | $32,848 |
| Standard Deviation (Population) | $21,962 | $32,595 |
Similar Demographics by Median Family Income
Demographics Similar to Immigrants from Guyana by Median Family Income
In terms of median family income, the demographic groups most similar to Immigrants from Guyana are Immigrants from El Salvador ($92,545, a difference of 0.030%), Immigrants from Somalia ($92,609, a difference of 0.10%), Immigrants from Barbados ($92,419, a difference of 0.10%), West Indian ($92,765, a difference of 0.27%), and Immigrants from Laos ($92,239, a difference of 0.30%).
| Demographics | Rating | Rank | Median Family Income |
| Guyanese | 0.9 /100 | #246 | Tragic $93,373 |
| Immigrants | Senegal | 0.7 /100 | #247 | Tragic $92,912 |
| French American Indians | 0.7 /100 | #248 | Tragic $92,872 |
| Immigrants | Ecuador | 0.7 /100 | #249 | Tragic $92,837 |
| West Indians | 0.6 /100 | #250 | Tragic $92,765 |
| Immigrants | Somalia | 0.6 /100 | #251 | Tragic $92,609 |
| Immigrants | El Salvador | 0.6 /100 | #252 | Tragic $92,545 |
| Immigrants | Guyana | 0.6 /100 | #253 | Tragic $92,513 |
| Immigrants | Barbados | 0.5 /100 | #254 | Tragic $92,419 |
| Immigrants | Laos | 0.5 /100 | #255 | Tragic $92,239 |
| Nicaraguans | 0.5 /100 | #256 | Tragic $92,231 |
| Americans | 0.4 /100 | #257 | Tragic $92,096 |
| Osage | 0.4 /100 | #258 | Tragic $91,926 |
| Cape Verdeans | 0.4 /100 | #259 | Tragic $91,848 |
| Pennsylvania Germans | 0.4 /100 | #260 | Tragic $91,763 |
Demographics Similar to Immigrants from Eritrea by Median Family Income
In terms of median family income, the demographic groups most similar to Immigrants from Eritrea are Belgian ($102,788, a difference of 0.030%), Finnish ($102,676, a difference of 0.14%), Alsatian ($103,010, a difference of 0.18%), Immigrants from Uzbekistan ($103,197, a difference of 0.36%), and Immigrants from Eastern Africa ($102,451, a difference of 0.36%).
| Demographics | Rating | Rank | Median Family Income |
| Slovaks | 63.1 /100 | #165 | Good $103,729 |
| English | 62.6 /100 | #166 | Good $103,684 |
| South American Indians | 61.9 /100 | #167 | Good $103,624 |
| Immigrants | Peru | 60.8 /100 | #168 | Good $103,534 |
| Czechoslovakians | 57.6 /100 | #169 | Average $103,273 |
| Immigrants | Uzbekistan | 56.6 /100 | #170 | Average $103,197 |
| Alsatians | 54.3 /100 | #171 | Average $103,010 |
| Immigrants | Eritrea | 51.9 /100 | #172 | Average $102,823 |
| Belgians | 51.4 /100 | #173 | Average $102,788 |
| Finns | 50.0 /100 | #174 | Average $102,676 |
| Immigrants | Eastern Africa | 47.1 /100 | #175 | Average $102,451 |
| French | 46.1 /100 | #176 | Average $102,368 |
| Germans | 44.6 /100 | #177 | Average $102,254 |
| Welsh | 43.3 /100 | #178 | Average $102,151 |
| South Americans | 39.7 /100 | #179 | Fair $101,856 |