Immigrants from Portugal vs Immigrants from Eritrea Median Family Income
COMPARE
Immigrants from Portugal
Immigrants from Eritrea
Median Family Income
Median Family Income Comparison
Immigrants from Portugal
Immigrants from Eritrea
$100,984
MEDIAN FAMILY INCOME
29.6/ 100
METRIC RATING
189th/ 347
METRIC RANK
$102,823
MEDIAN FAMILY INCOME
51.9/ 100
METRIC RATING
172nd/ 347
METRIC RANK
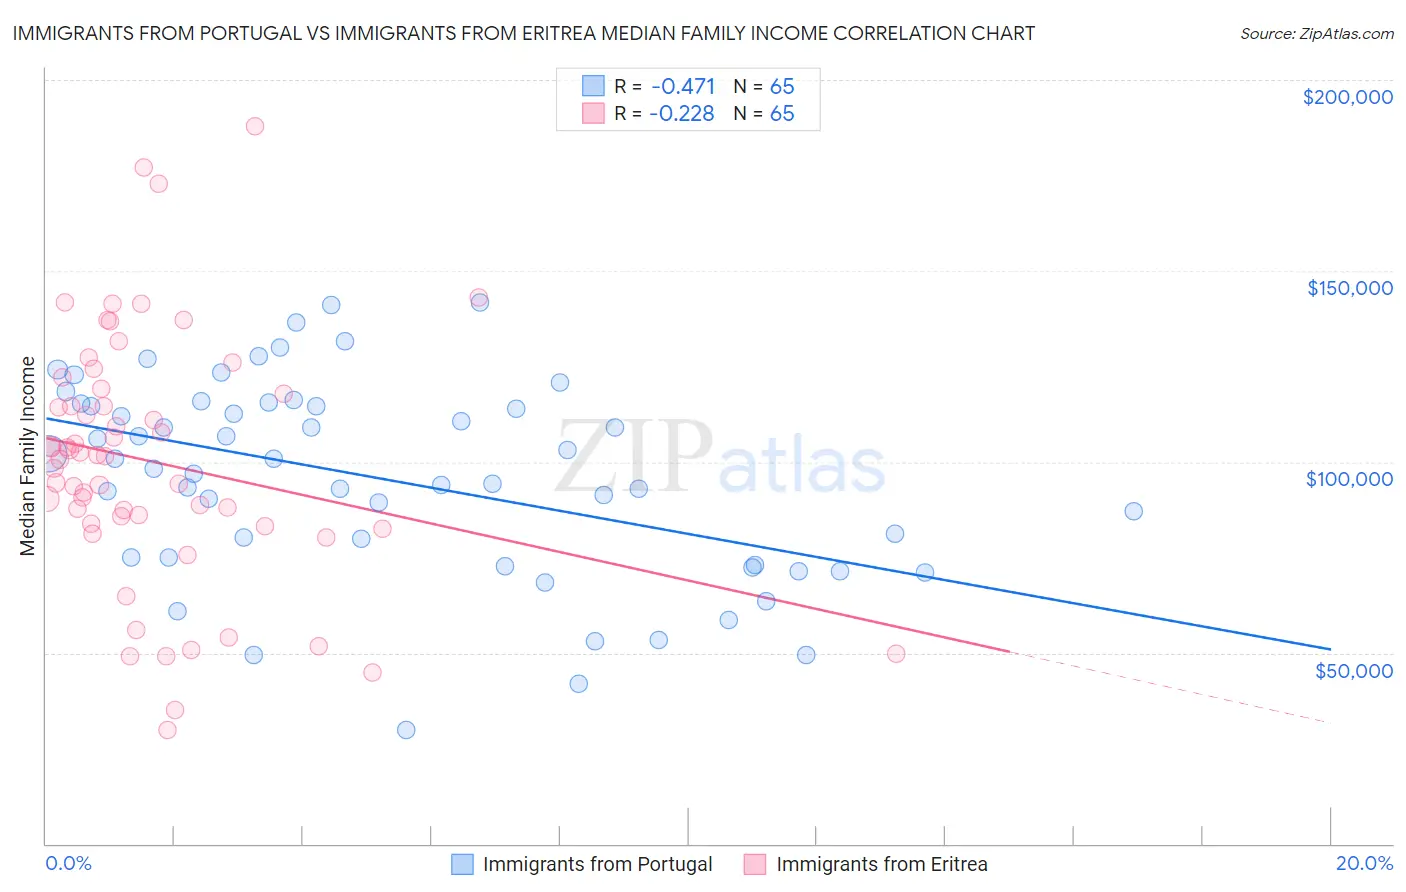
Immigrants from Portugal vs Immigrants from Eritrea Median Family Income Correlation Chart
The statistical analysis conducted on geographies consisting of 174,753,640 people shows a moderate negative correlation between the proportion of Immigrants from Portugal and median family income in the United States with a correlation coefficient (R) of -0.471 and weighted average of $100,984. Similarly, the statistical analysis conducted on geographies consisting of 104,842,839 people shows a weak negative correlation between the proportion of Immigrants from Eritrea and median family income in the United States with a correlation coefficient (R) of -0.228 and weighted average of $102,823, a difference of 1.8%.
Median Family Income Correlation Summary
| Measurement | Immigrants from Portugal | Immigrants from Eritrea |
| Minimum | $29,911 | $29,777 |
| Maximum | $141,703 | $188,047 |
| Range | $111,792 | $158,270 |
| Mean | $95,434 | $99,919 |
| Median | $98,112 | $101,536 |
| Interquartile 25% (IQ1) | $73,840 | $83,487 |
| Interquartile 75% (IQ3) | $114,950 | $118,485 |
| Interquartile Range (IQR) | $41,110 | $34,998 |
| Standard Deviation (Sample) | $25,863 | $32,848 |
| Standard Deviation (Population) | $25,663 | $32,595 |
Demographics Similar to Immigrants from Portugal and Immigrants from Eritrea by Median Family Income
In terms of median family income, the demographic groups most similar to Immigrants from Portugal are Immigrants ($100,962, a difference of 0.020%), Guamanian/Chamorro ($101,061, a difference of 0.080%), Tlingit-Haida ($101,092, a difference of 0.11%), Celtic ($101,139, a difference of 0.15%), and Dutch ($101,192, a difference of 0.21%). Similarly, the demographic groups most similar to Immigrants from Eritrea are Belgian ($102,788, a difference of 0.030%), Finnish ($102,676, a difference of 0.14%), Alsatian ($103,010, a difference of 0.18%), Immigrants from Uzbekistan ($103,197, a difference of 0.36%), and Immigrants from Eastern Africa ($102,451, a difference of 0.36%).
| Demographics | Rating | Rank | Median Family Income |
| Immigrants | Uzbekistan | 56.6 /100 | #170 | Average $103,197 |
| Alsatians | 54.3 /100 | #171 | Average $103,010 |
| Immigrants | Eritrea | 51.9 /100 | #172 | Average $102,823 |
| Belgians | 51.4 /100 | #173 | Average $102,788 |
| Finns | 50.0 /100 | #174 | Average $102,676 |
| Immigrants | Eastern Africa | 47.1 /100 | #175 | Average $102,451 |
| French | 46.1 /100 | #176 | Average $102,368 |
| Germans | 44.6 /100 | #177 | Average $102,254 |
| Welsh | 43.3 /100 | #178 | Average $102,151 |
| South Americans | 39.7 /100 | #179 | Fair $101,856 |
| French Canadians | 37.0 /100 | #180 | Fair $101,634 |
| Spaniards | 36.8 /100 | #181 | Fair $101,617 |
| Tsimshian | 35.9 /100 | #182 | Fair $101,543 |
| Kenyans | 34.5 /100 | #183 | Fair $101,417 |
| Immigrants | Costa Rica | 33.7 /100 | #184 | Fair $101,354 |
| Dutch | 31.9 /100 | #185 | Fair $101,192 |
| Celtics | 31.3 /100 | #186 | Fair $101,139 |
| Tlingit-Haida | 30.8 /100 | #187 | Fair $101,092 |
| Guamanians/Chamorros | 30.5 /100 | #188 | Fair $101,061 |
| Immigrants | Portugal | 29.6 /100 | #189 | Fair $100,984 |
| Immigrants | Immigrants | 29.4 /100 | #190 | Fair $100,962 |