Immigrants from Hong Kong vs Immigrants from Eritrea Median Family Income
COMPARE
Immigrants from Hong Kong
Immigrants from Eritrea
Median Family Income
Median Family Income Comparison
Immigrants from Hong Kong
Immigrants from Eritrea
$131,067
MEDIAN FAMILY INCOME
100.0/ 100
METRIC RATING
7th/ 347
METRIC RANK
$102,823
MEDIAN FAMILY INCOME
51.9/ 100
METRIC RATING
172nd/ 347
METRIC RANK
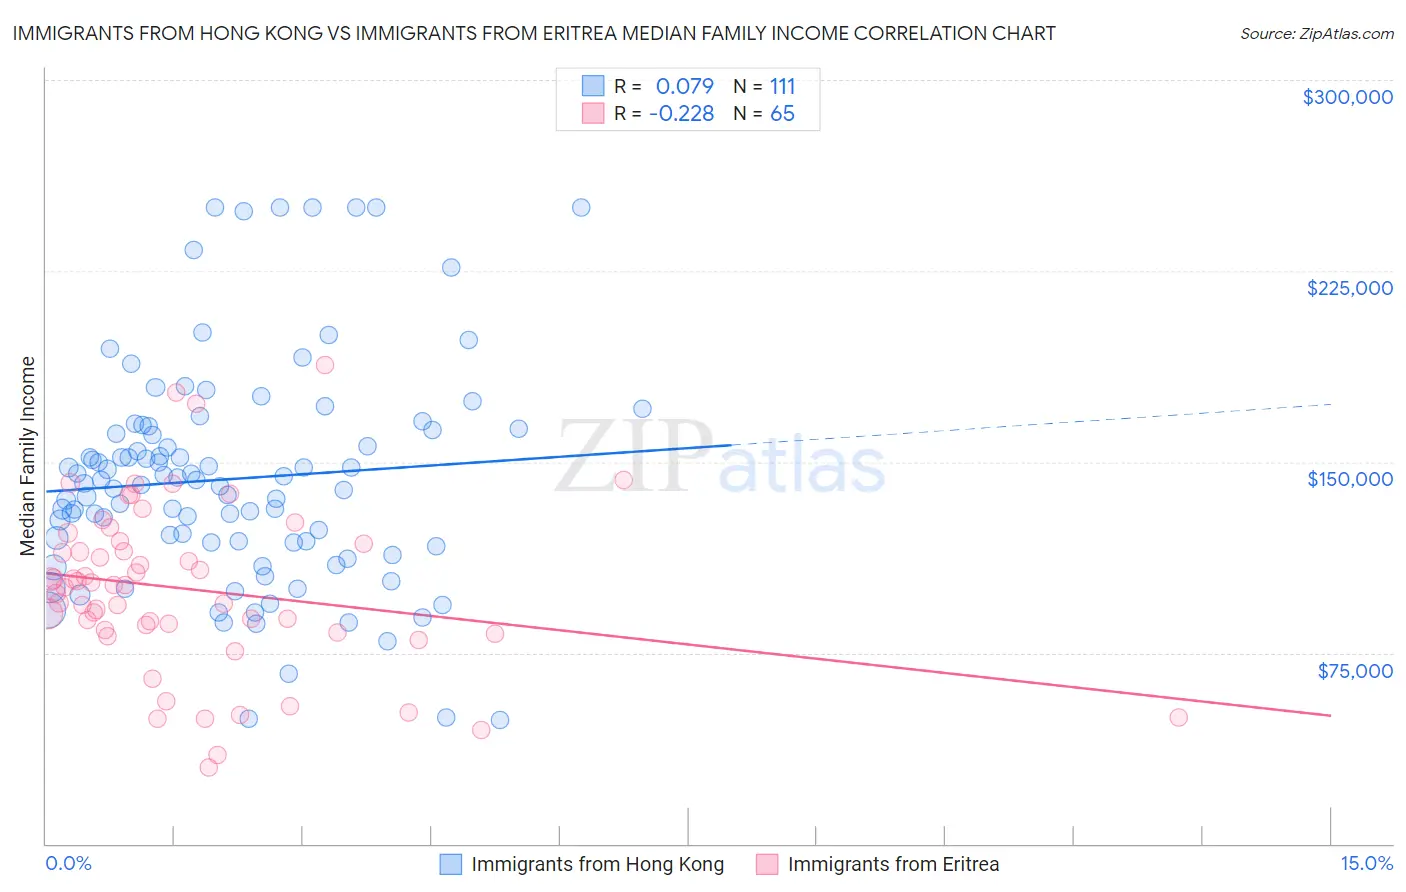
Immigrants from Hong Kong vs Immigrants from Eritrea Median Family Income Correlation Chart
The statistical analysis conducted on geographies consisting of 253,853,035 people shows a slight positive correlation between the proportion of Immigrants from Hong Kong and median family income in the United States with a correlation coefficient (R) of 0.079 and weighted average of $131,067. Similarly, the statistical analysis conducted on geographies consisting of 104,842,839 people shows a weak negative correlation between the proportion of Immigrants from Eritrea and median family income in the United States with a correlation coefficient (R) of -0.228 and weighted average of $102,823, a difference of 27.5%.
Median Family Income Correlation Summary
| Measurement | Immigrants from Hong Kong | Immigrants from Eritrea |
| Minimum | $48,750 | $29,777 |
| Maximum | $250,001 | $188,047 |
| Range | $201,251 | $158,270 |
| Mean | $143,316 | $99,919 |
| Median | $141,440 | $101,536 |
| Interquartile 25% (IQ1) | $118,209 | $83,487 |
| Interquartile 75% (IQ3) | $163,135 | $118,485 |
| Interquartile Range (IQR) | $44,926 | $34,998 |
| Standard Deviation (Sample) | $43,770 | $32,848 |
| Standard Deviation (Population) | $43,572 | $32,595 |
Similar Demographics by Median Family Income
Demographics Similar to Immigrants from Hong Kong by Median Family Income
In terms of median family income, the demographic groups most similar to Immigrants from Hong Kong are Immigrants from Iran ($130,894, a difference of 0.13%), Thai ($131,281, a difference of 0.16%), Okinawan ($129,979, a difference of 0.84%), Iranian ($133,839, a difference of 2.1%), and Immigrants from India ($134,028, a difference of 2.3%).
| Demographics | Rating | Rank | Median Family Income |
| Filipinos | 100.0 /100 | #1 | Exceptional $138,397 |
| Immigrants | Taiwan | 100.0 /100 | #2 | Exceptional $136,949 |
| Immigrants | Singapore | 100.0 /100 | #3 | Exceptional $134,818 |
| Immigrants | India | 100.0 /100 | #4 | Exceptional $134,028 |
| Iranians | 100.0 /100 | #5 | Exceptional $133,839 |
| Thais | 100.0 /100 | #6 | Exceptional $131,281 |
| Immigrants | Hong Kong | 100.0 /100 | #7 | Exceptional $131,067 |
| Immigrants | Iran | 100.0 /100 | #8 | Exceptional $130,894 |
| Okinawans | 100.0 /100 | #9 | Exceptional $129,979 |
| Immigrants | Ireland | 100.0 /100 | #10 | Exceptional $127,584 |
| Immigrants | Israel | 100.0 /100 | #11 | Exceptional $127,430 |
| Cypriots | 100.0 /100 | #12 | Exceptional $127,064 |
| Immigrants | Australia | 100.0 /100 | #13 | Exceptional $126,620 |
| Immigrants | South Central Asia | 100.0 /100 | #14 | Exceptional $125,956 |
| Eastern Europeans | 100.0 /100 | #15 | Exceptional $125,546 |
Demographics Similar to Immigrants from Eritrea by Median Family Income
In terms of median family income, the demographic groups most similar to Immigrants from Eritrea are Belgian ($102,788, a difference of 0.030%), Finnish ($102,676, a difference of 0.14%), Alsatian ($103,010, a difference of 0.18%), Immigrants from Uzbekistan ($103,197, a difference of 0.36%), and Immigrants from Eastern Africa ($102,451, a difference of 0.36%).
| Demographics | Rating | Rank | Median Family Income |
| Slovaks | 63.1 /100 | #165 | Good $103,729 |
| English | 62.6 /100 | #166 | Good $103,684 |
| South American Indians | 61.9 /100 | #167 | Good $103,624 |
| Immigrants | Peru | 60.8 /100 | #168 | Good $103,534 |
| Czechoslovakians | 57.6 /100 | #169 | Average $103,273 |
| Immigrants | Uzbekistan | 56.6 /100 | #170 | Average $103,197 |
| Alsatians | 54.3 /100 | #171 | Average $103,010 |
| Immigrants | Eritrea | 51.9 /100 | #172 | Average $102,823 |
| Belgians | 51.4 /100 | #173 | Average $102,788 |
| Finns | 50.0 /100 | #174 | Average $102,676 |
| Immigrants | Eastern Africa | 47.1 /100 | #175 | Average $102,451 |
| French | 46.1 /100 | #176 | Average $102,368 |
| Germans | 44.6 /100 | #177 | Average $102,254 |
| Welsh | 43.3 /100 | #178 | Average $102,151 |
| South Americans | 39.7 /100 | #179 | Fair $101,856 |