Iraqi vs Immigrants from Southern Europe Median Family Income
COMPARE
Iraqi
Immigrants from Southern Europe
Median Family Income
Median Family Income Comparison
Iraqis
Immigrants from Southern Europe
$100,658
MEDIAN FAMILY INCOME
26.3/ 100
METRIC RATING
193rd/ 347
METRIC RANK
$110,614
MEDIAN FAMILY INCOME
98.3/ 100
METRIC RATING
91st/ 347
METRIC RANK
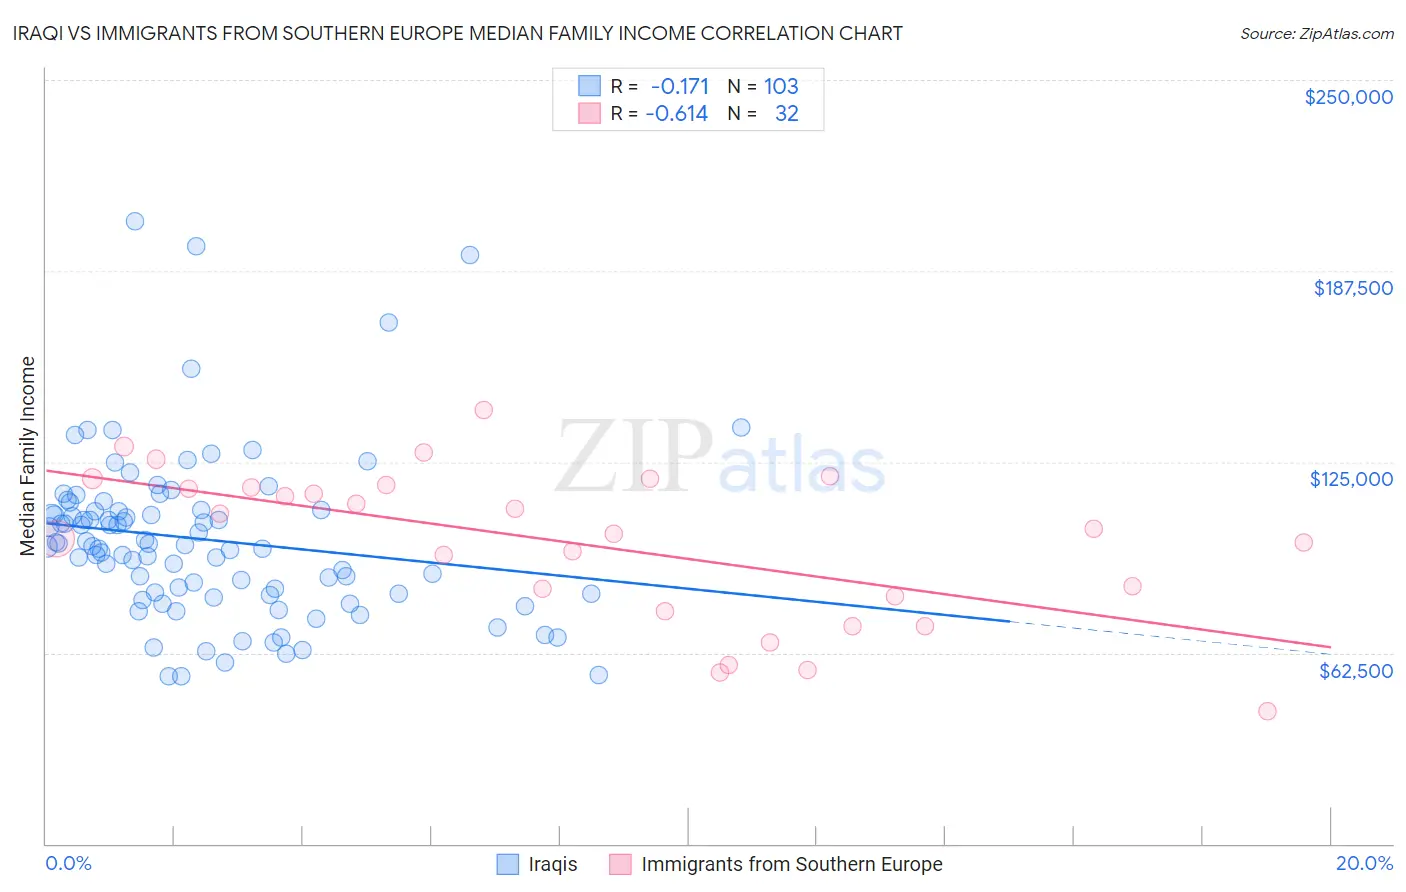
Iraqi vs Immigrants from Southern Europe Median Family Income Correlation Chart
The statistical analysis conducted on geographies consisting of 170,585,790 people shows a poor negative correlation between the proportion of Iraqis and median family income in the United States with a correlation coefficient (R) of -0.171 and weighted average of $100,658. Similarly, the statistical analysis conducted on geographies consisting of 402,509,296 people shows a significant negative correlation between the proportion of Immigrants from Southern Europe and median family income in the United States with a correlation coefficient (R) of -0.614 and weighted average of $110,614, a difference of 9.9%.
Median Family Income Correlation Summary
| Measurement | Iraqi | Immigrants from Southern Europe |
| Minimum | $54,690 | $43,571 |
| Maximum | $203,844 | $141,836 |
| Range | $149,154 | $98,265 |
| Mean | $99,589 | $97,967 |
| Median | $97,704 | $102,217 |
| Interquartile 25% (IQ1) | $81,823 | $78,639 |
| Interquartile 75% (IQ3) | $109,149 | $117,023 |
| Interquartile Range (IQR) | $27,326 | $38,384 |
| Standard Deviation (Sample) | $27,377 | $25,189 |
| Standard Deviation (Population) | $27,244 | $24,793 |
Similar Demographics by Median Family Income
Demographics Similar to Iraqis by Median Family Income
In terms of median family income, the demographic groups most similar to Iraqis are Uruguayan ($100,656, a difference of 0.0%), Immigrants from Kenya ($100,679, a difference of 0.020%), Colombian ($100,750, a difference of 0.090%), Immigrants from South America ($100,414, a difference of 0.24%), and Immigrants ($100,962, a difference of 0.30%).
| Demographics | Rating | Rank | Median Family Income |
| Celtics | 31.3 /100 | #186 | Fair $101,139 |
| Tlingit-Haida | 30.8 /100 | #187 | Fair $101,092 |
| Guamanians/Chamorros | 30.5 /100 | #188 | Fair $101,061 |
| Immigrants | Portugal | 29.6 /100 | #189 | Fair $100,984 |
| Immigrants | Immigrants | 29.4 /100 | #190 | Fair $100,962 |
| Colombians | 27.2 /100 | #191 | Fair $100,750 |
| Immigrants | Kenya | 26.5 /100 | #192 | Fair $100,679 |
| Iraqis | 26.3 /100 | #193 | Fair $100,658 |
| Uruguayans | 26.3 /100 | #194 | Fair $100,656 |
| Immigrants | South America | 23.9 /100 | #195 | Fair $100,414 |
| Samoans | 23.3 /100 | #196 | Fair $100,344 |
| Immigrants | Cameroon | 22.8 /100 | #197 | Fair $100,289 |
| Immigrants | Africa | 22.5 /100 | #198 | Fair $100,256 |
| Yugoslavians | 21.3 /100 | #199 | Fair $100,119 |
| Spanish | 20.1 /100 | #200 | Fair $99,977 |
Demographics Similar to Immigrants from Southern Europe by Median Family Income
In terms of median family income, the demographic groups most similar to Immigrants from Southern Europe are Northern European ($110,635, a difference of 0.020%), Immigrants from Argentina ($110,873, a difference of 0.23%), Immigrants from Lebanon ($110,159, a difference of 0.41%), Immigrants from Kazakhstan ($110,137, a difference of 0.43%), and Korean ($110,103, a difference of 0.46%).
| Demographics | Rating | Rank | Median Family Income |
| Immigrants | Hungary | 98.8 /100 | #84 | Exceptional $111,378 |
| Croatians | 98.8 /100 | #85 | Exceptional $111,370 |
| Ukrainians | 98.8 /100 | #86 | Exceptional $111,368 |
| Austrians | 98.8 /100 | #87 | Exceptional $111,306 |
| Romanians | 98.8 /100 | #88 | Exceptional $111,243 |
| Immigrants | Argentina | 98.5 /100 | #89 | Exceptional $110,873 |
| Northern Europeans | 98.3 /100 | #90 | Exceptional $110,635 |
| Immigrants | Southern Europe | 98.3 /100 | #91 | Exceptional $110,614 |
| Immigrants | Lebanon | 97.9 /100 | #92 | Exceptional $110,159 |
| Immigrants | Kazakhstan | 97.8 /100 | #93 | Exceptional $110,137 |
| Koreans | 97.8 /100 | #94 | Exceptional $110,103 |
| Zimbabweans | 97.7 /100 | #95 | Exceptional $110,011 |
| Immigrants | Moldova | 97.7 /100 | #96 | Exceptional $109,975 |
| Jordanians | 97.5 /100 | #97 | Exceptional $109,865 |
| Immigrants | Kuwait | 97.4 /100 | #98 | Exceptional $109,731 |